
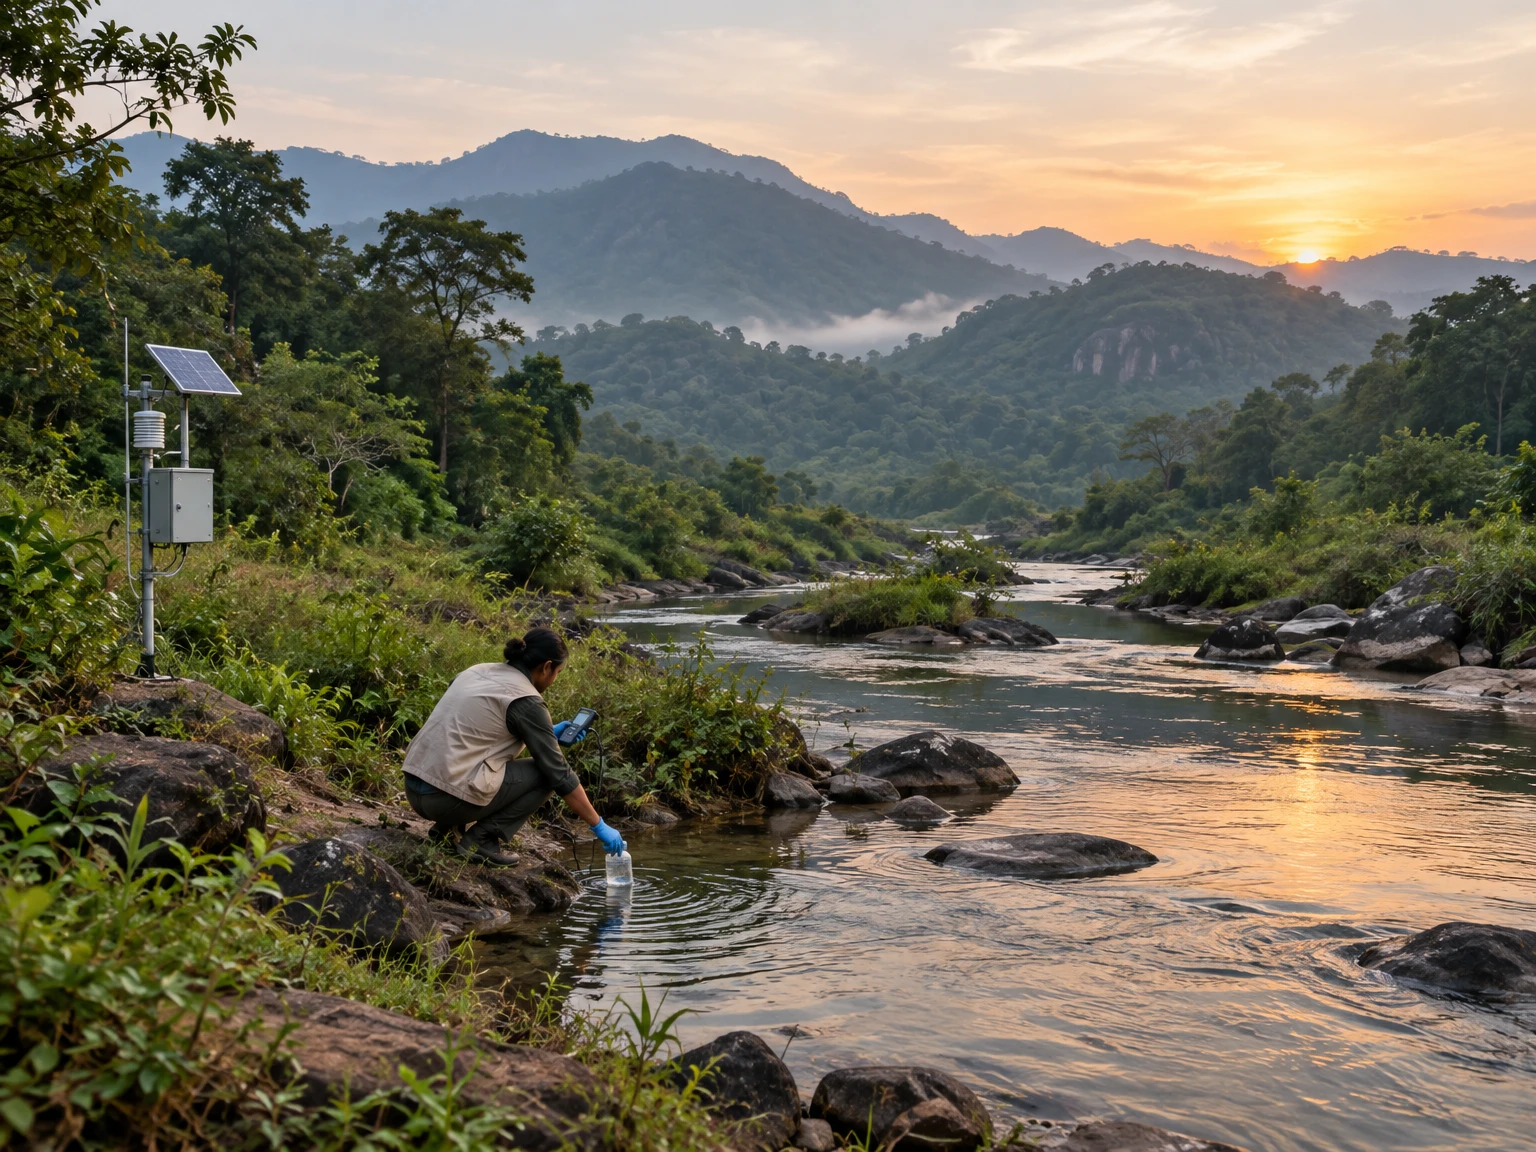
Environmental monitoring is often described as a technical activity: install an instrument, collect a sample, publish a number. For Odisha, the more important question is what connects that number to a decision. A reading becomes useful evidence only when people can understand where and how it was obtained, what it can and cannot establish, and what action follows. This is a practical science problem as much as an engineering one.
The 17th Odisha Environment Congress, hosted at NIT Rourkela under the theme “Environment and Technology,” recently concluded with discussion of climate change, environmental governance, pollution control, renewable energy, sustainable mining, biodiversity and digital environmental monitoring. The Odisha State Pollution Control Board’s public pages also make air and water monitoring material available. Together, these are reminders that measurement matters most when its chain of custody—from field observation to public decision—is strong.
Monitoring begins with a question
Before choosing a sensor or sampling location, define the question. Is the aim to describe conditions at one site, compare locations, detect a short-lived event, assess a long-term trend, or evaluate whether a particular intervention is working? These are different tasks. A single station can describe its immediate surroundings on a given day; it cannot automatically represent an entire district. A short series may catch a striking episode but cannot establish a long-term change. A before-and-after comparison may be informative, but only if season, weather, operating conditions and measurement methods are considered.
A clear question shapes the design. A study of roadside exposure needs sites and times that reflect traffic and people’s use of the road. A river-quality question needs a defined reach, sampling points, season and purpose. A land-cover question may be suited to satellite imagery, but a satellite classification alone cannot say why a change occurred. Writing the question first helps avoid collecting impressive-looking data that cannot answer it.
What counts as environmental evidence?
Evidence is not simply a number. It is a number, observation or mapped pattern plus context: location, date and time, method, instrument or laboratory, units, detection limits, missing values, quality checks and relevant conditions. An air-quality value without the station identity and sampling period is difficult to interpret. A water sample without the river reach, recent rainfall, collection method or laboratory method loses important meaning. Metadata may feel administrative, but it is part of the scientific result.
Environmental systems vary across space and time. A station near a busy road, industrial source or construction site may record a different local mixture from one in a quieter neighbourhood. A river can change after rainfall, during low flow, near an outfall or downstream from a settlement. In forests and coastal habitats, season, vegetation, tide, fire and land use all affect what a snapshot shows. Comparisons are fair only when these differences are described or addressed in the design.
Air monitoring: read the whole table
Odisha’s pollution-control information includes ambient-air data with monitored pollutants such as PM10, PM2.5, sulphur dioxide, nitrogen dioxide, ammonia and ozone, alongside an Air Quality Index category and prominent pollutant. These columns answer related but distinct questions. Concentrations describe measured pollutants; an index condenses selected measurements into a communication scale. A category helps readers grasp a day’s broad status, while the underlying values and station count preserve detail.
For example, the Board’s displayed Bhubaneswar table includes a 6 November 2025 entry with four monitored stations, a reported AQI of 129, a “moderate” category and PM10 listed as prominent pollutant. That is an example tied to the date and coverage printed on the page, not a claim about air today or every part of the city. A reader should look at the date, station count, units and pollutants before comparing it with another day. If station coverage differs, the difference itself can affect how representative the comparison is.
One station is a window, not a whole city
Monitoring stations are placed to serve purposes, not to make every location identical. A station may be intended to characterize urban background, roadside conditions, an industrial area or another defined setting. To interpret a result, readers need to know what kind of site it is and what lies nearby. A high reading at one location can be important, but it should not be casually generalized to every resident or neighbourhood. Conversely, a low reading at one site does not rule out local exposure elsewhere.
Temporal coverage matters too. A daily value, a monthly average and a real-time feed are not interchangeable. Short-term peaks may disappear inside averages; averages can reveal persistent patterns that an isolated peak cannot. Data gaps can coincide with equipment downtime, power loss, maintenance or communication failure. The gap should be shown, not silently treated as clean air or as an ordinary day. Good public reporting states the scale of inference: this site, this interval, these measurements.
Water monitoring follows rivers and seasons
The Odisha State Pollution Control Board’s environmental-monitoring page links to water-quality information and monitoring stations under the National Water Quality Monitoring Programme. It identifies major river systems including the Mahanadi, Brahmani, Baitarani, Rushikulya, Nagavali, Subarnarekha, Budhabalanga, Kolab, Vansadhara, Indravati and Bahuda. The page also lists year-wise Water Quality Index material and current-year data links. This kind of public structure can help readers locate information, but a linked index is not a substitute for inspecting the measurements and their methods.
A river sample is a point in a moving system. Its meaning depends on where it was collected, whether it was upstream or downstream of a relevant source, the flow and recent weather, the substances measured and the sampling frequency. A single sample may identify a reason to investigate further; it rarely explains an entire river’s condition. Repeated sampling at well-described locations can show whether a pattern persists, changes seasonally or follows a specific event. A careful account distinguishes a measured result from a source attribution, which may need additional evidence.
From field sample to trustworthy result
Quality assurance starts before a sample reaches a laboratory. Teams need written protocols, clean and suitable containers, calibrated instruments, consistent collection procedures, labels that preserve the sample’s identity, and records of time, weather and location. Depending on the parameter, samples may need preservation, cooling or rapid transport. A chain-of-custody record makes clear who collected and handled a sample and when. These practices reduce avoidable uncertainty; they do not make every result perfect.
Laboratory quality controls, blanks, duplicates, reference materials and documented detection limits help identify contamination, instrument drift or inconsistent measurement. Results should not be reported with more precision than the method supports. When a value is below a detection limit, it is not necessarily zero. When a test is missing, delayed or invalidated, the record should show that status. Clear quality notes allow readers and decision-makers to distinguish an environmental signal from a measurement problem.
Remote sensing adds a landscape view
Satellites and geographic information systems can observe patterns across large areas that field stations cannot cover continuously. Odisha’s forest and ecology work describes the use of GIS, remote sensing and GPS-based information for forest-block inventories, spatial decision support, fire monitoring, plantations and wildlife-habitat applications. Satellite imagery can help map land cover, identify change that deserves investigation and guide where field teams should look. It is particularly useful when the question concerns broad spatial patterns or change over time.
But a mapped pixel is not a complete explanation. Different land covers can look similar in imagery; clouds, shadows, sensor resolution and classification rules affect what is visible. A map can flag a possible change without identifying the responsible activity, its legal status or its ecological effect. Field visits, records, local knowledge and other sources may be needed to validate interpretation. Combining remote sensing with ground observations is stronger than treating either one as an all-purpose answer.
Citizen observations can help, with boundaries
Residents, students, community groups and local organisations can notice changes that formal networks may not capture: unusual discharge, fish mortality, smoke, dust, erosion, flooding, fire or a damaged sensor. Their observations can help agencies prioritise inspection and can add local context to measured data. A useful report records when and where something happened, what was directly seen, how long it lasted and whether photographs or other supporting information exist. It should distinguish observation from interpretation: “water appeared discoloured” is not the same as naming a pollutant.
Community participation works best when the purpose and limits are explained openly. A low-cost sensor may be valuable for learning about relative patterns, yet not be equivalent to a regulatory monitor. Training, consistent protocols, safe procedures, clear data ownership and feedback to contributors matter. Research on citizen science and water-quality monitoring notes that volunteer data can contribute to some physicochemical and ecological measures, while microbial measurements require particularly careful quality control and laboratory validation. Participation should strengthen evidence, not create false certainty or place hazardous sampling burdens on residents.
Data quality is a public trust issue
People are more likely to trust environmental information when they can see how it was produced and what limitations apply. A public table should use stable names for stations and parameters, readable units, dates in an unambiguous format, and a legend for index categories. It should tell users whether data are preliminary, validated, delayed or revised. If an instrument was offline, mark the period as unavailable rather than filling it with an assumed value. If the method changes, explain how that affects comparison with earlier years.
Quality control should be proportionate to the decision. Exploratory screening may tolerate more uncertainty than a regulatory determination, but both should communicate the uncertainty honestly. Where several sources disagree, retain the disagreement and investigate whether differences in location, method, dates or definitions explain it. Avoid the temptation to select whichever value best supports a preferred narrative. A transparent record gives future analysts the ability to revisit a conclusion when better information becomes available.
Trends require comparable observations
A trend is a pattern across comparable observations, not a sequence of unrelated numbers. Before saying that pollution has increased or decreased, check whether the same stations, parameters, averaging periods and methods are represented. Consider seasonal cycles, rainfall, temperature, wind, river flow, holidays, industrial schedules and other factors relevant to the question. These influences do not invalidate measurement; they guide interpretation. A meaningful analysis explains which factors were considered and which could not be assessed.
Changing monitoring coverage is itself important. If new stations are added, an apparent change in an average may partly reflect where measurements are now taken. If old stations disappear, the remaining network may represent a different mix of places. Analysts can compare stable stations separately, or show network changes alongside the results. The goal is not to make the data look complicated; it is to prevent a simple chart from implying a change in the environment when the underlying measurement design also changed.
From measurement to action
Monitoring has public value when it informs a response. Depending on the issue, that may mean a targeted inspection, a repeat sample, maintenance of a control system, improved public information, a change in traffic management, an investigation of a discharge or a conservation intervention. The data do not decide every question by themselves. They help identify where attention is warranted, whether a standard or threshold is relevant, and whether a chosen action changes conditions over time.
A useful programme therefore defines a feedback loop: observe, check, interpret, decide, act and measure again. The final step is not an afterthought. If an intervention is intended to reduce dust, improve wastewater treatment or protect a habitat, monitoring should be designed to test the intended outcome. Results should be shared with the people affected and with the institutions responsible for action. Without follow-up, monitoring can become a collection of tables rather than a tool for learning and accountability.
Pair indicators with local knowledge
Indicators simplify complex conditions so people can compare and communicate them, but simplification can hide what matters locally. A citywide AQI category cannot describe every street; a water-quality index cannot capture every ecological or cultural relationship with a river. Data from official networks should be read alongside local geography, land use, infrastructure, community observations and the question being asked. Local knowledge is not a replacement for measurement; it can help design better measurements and identify interpretations that need testing.
At the same time, anecdotes should not be treated as proof of a widespread pattern. A careful process takes community reports seriously, documents them, looks for corroboration and communicates what the follow-up found. When a concern cannot yet be verified, say what evidence exists and what would answer the remaining question. This approach avoids two opposite errors: dismissing people because their observation is not a laboratory result, and presenting an untested interpretation as established fact.
Digital tools need accountable design
Dashboards, mobile forms, automated sensors and maps can make monitoring faster and more accessible. They can also create an illusion of certainty when values are displayed without timestamps, calibration status, station details or an explanation of missing data. A well-designed dashboard should make it easy to see the reporting period, source, measurement method, units and quality status. It should allow a user to distinguish a live value from a validated dataset and should preserve historical revisions rather than silently replacing them.
Digital systems should be built around the work they support. If a warning is issued, someone should know who receives it, who verifies it and what response follows. If data are collected from community contributors, the system should explain how location and personal details are handled. If automated classifications are used for maps or imagery, the method and limitations should be documented. Technology can reduce delays and reveal patterns, but reliable institutions and transparent procedures remain essential.
Coordination across institutions
Environmental questions often cross administrative and scientific boundaries. Air, water, forests, agriculture, transport, public health, industry and local government may each hold a relevant part of the picture. Coordination helps avoid duplicate sampling, inconsistent station labels and gaps between measurement and response. Shared definitions, interoperable data formats, clear responsibilities and agreed escalation routes can make information more useful without requiring every agency to use the same instrument or serve the same purpose.
The recent Odisha Environment Congress brought together technical institutions, universities, government organisations, non-government groups and research organisations, as described in its public summary. Such meetings are useful when they turn discussion into practical cooperation: shared protocols, training, accessible datasets, field validation and sustained research partnerships. A conference announcement alone does not demonstrate that a policy or environmental outcome has changed. Follow-up evidence—published methods, implemented plans, measured results and public reporting—is what shows whether ideas became durable practice.
How a reader can assess a claim
When encountering an environmental headline or chart, start with a few questions. What exactly was measured? Where and when? Is the value from one station, several stations or a model? What is the unit and averaging period? Are the data validated, and are there gaps? Is the comparison using the same method and locations? Does the evidence support the stated cause, or only show that two things occurred together? These questions are not meant to discredit every report. They help separate a useful finding from a claim that goes beyond its evidence.
Look for the original data source when possible, then check the source’s date and context. A social post may quote a real number while omitting its station or time period. A map may use a different legend from another map. A press release may describe a programme’s intention rather than its measured effect. If the data are not available, the honest conclusion is that the public cannot yet assess the claim from that page alone. A good explainer makes the evidence trail easy to follow.
A practical monitoring roadmap for Odisha
A useful programme can begin with a small, well-defined question rather than a large technology purchase. First, identify the decision or public need. Second, map existing monitoring stations, published datasets, responsible agencies and known gaps. Third, select a method suited to the question and document the protocol. Fourth, set standards for calibration, sample handling, metadata, quality flags and data retention. Fifth, plan how results will be checked, interpreted and explained to the people who need them.
Next, decide how a signal will prompt action and who owns each step. Create a clear route for follow-up when measurements cross a relevant threshold or when a community report raises a concern. Include maintenance, training, funding and data publication in the design, not only equipment procurement. Then review performance: are data arriving on time, are sites representative of the intended purpose, are results understandable, and are responses being completed? Revising a programme in light of these checks is a sign of good science, not failure.
Equity, safety and responsible communication
Monitoring should consider who is measured, who can access results and who bears the burden of environmental harm or fieldwork. Sites chosen only for convenience may miss communities near roads, industrial areas, flood-prone corridors or sensitive habitats. Sampling teams need safe procedures and appropriate training. Community partners should understand the project’s purpose and receive feedback, rather than being asked to contribute data that disappear into a report they never see.
Communication should avoid alarmism and false reassurance alike. A single elevated reading is a reason to inspect context and, where appropriate, repeat or broaden measurement; it is not automatically proof of a specific source. A reassuring average does not erase local or short-term concerns. Public summaries can be accessible without hiding the underlying data. State what was measured, what it suggests, what remains uncertain and what follow-up is planned. This is especially important when people may make decisions based on the information.
Why the evidence chain matters
Odisha’s public environmental data pages, monitoring programmes and research institutions provide building blocks for a stronger evidence system. Their value grows when measurements are comparable, methods are visible, local observations are treated respectfully, and results are linked to institutions capable of responding. Air-quality tables, river monitoring, remote-sensing maps and citizen reports each illuminate different parts of the landscape. None is a universal substitute for the others.
The central lesson is straightforward: measure with a question in mind, preserve the context around every result, and follow the evidence through to a response. Environmental technology can help make patterns visible across a large and diverse state, from urban neighbourhoods to river basins, forests and coasts. Trust is earned not by claiming that every dataset is complete, but by showing what is known, how it is known and what will be done next. That is how observation becomes evidence that can serve Odisha.
Sources and further reading
- Press Information Bureau, “17th Odisha Environment Congress Concludes at NIT Rourkela; Institute Honoured with S. B. Mishra Green Corporate Award,” 6 November 2026: https://www.pib.gov.in/PressReleaseDetail.aspx?PRID=2333772®=21&lang=1
- Odisha State Pollution Control Board, Environmental Monitoring Data: https://ospcboard.odisha.gov.in/environmental-monitoring-data/
- Odisha State Pollution Control Board, Ambient Air Quality Data: https://ospcboard.odisha.gov.in/ambient-air-quality-data/
- Odisha State Pollution Control Board, National Ambient Air Quality Monitoring Programme: https://ospcboard.odisha.gov.in/programs-projects/ekamra/
- Odisha Forest Department, Forest Information Technology and Geomatics Centre: https://odishaforest.in/fitgc
- National Remote Sensing Centre, Forestry and Ecology Applications: https://www.nrsc.gov.in/nrscnew/Apps_Forestry_Ecology.php
- Central Pollution Control Board, monitoring and air- and water-quality resources: https://cpcb.gov.in/indexeng.php
- “Citizen science and SDG 6.3.2 water-quality monitoring,” Environmental Research Letters, 2024: https://iopscience.iop.org/article/10.1088/1748-9326/ad7305
This content is a collection of ancient history,books and various articles and collection of library and news and other post ; all details may not be the same. Readers are requested to verify the information themselves. Readers are not allowed to take any disciplinary action; content is only for educational purposes. If readers do not agree about the contents, they may send a personal comment to my personal email ID: achary.purna@gmail.com
