
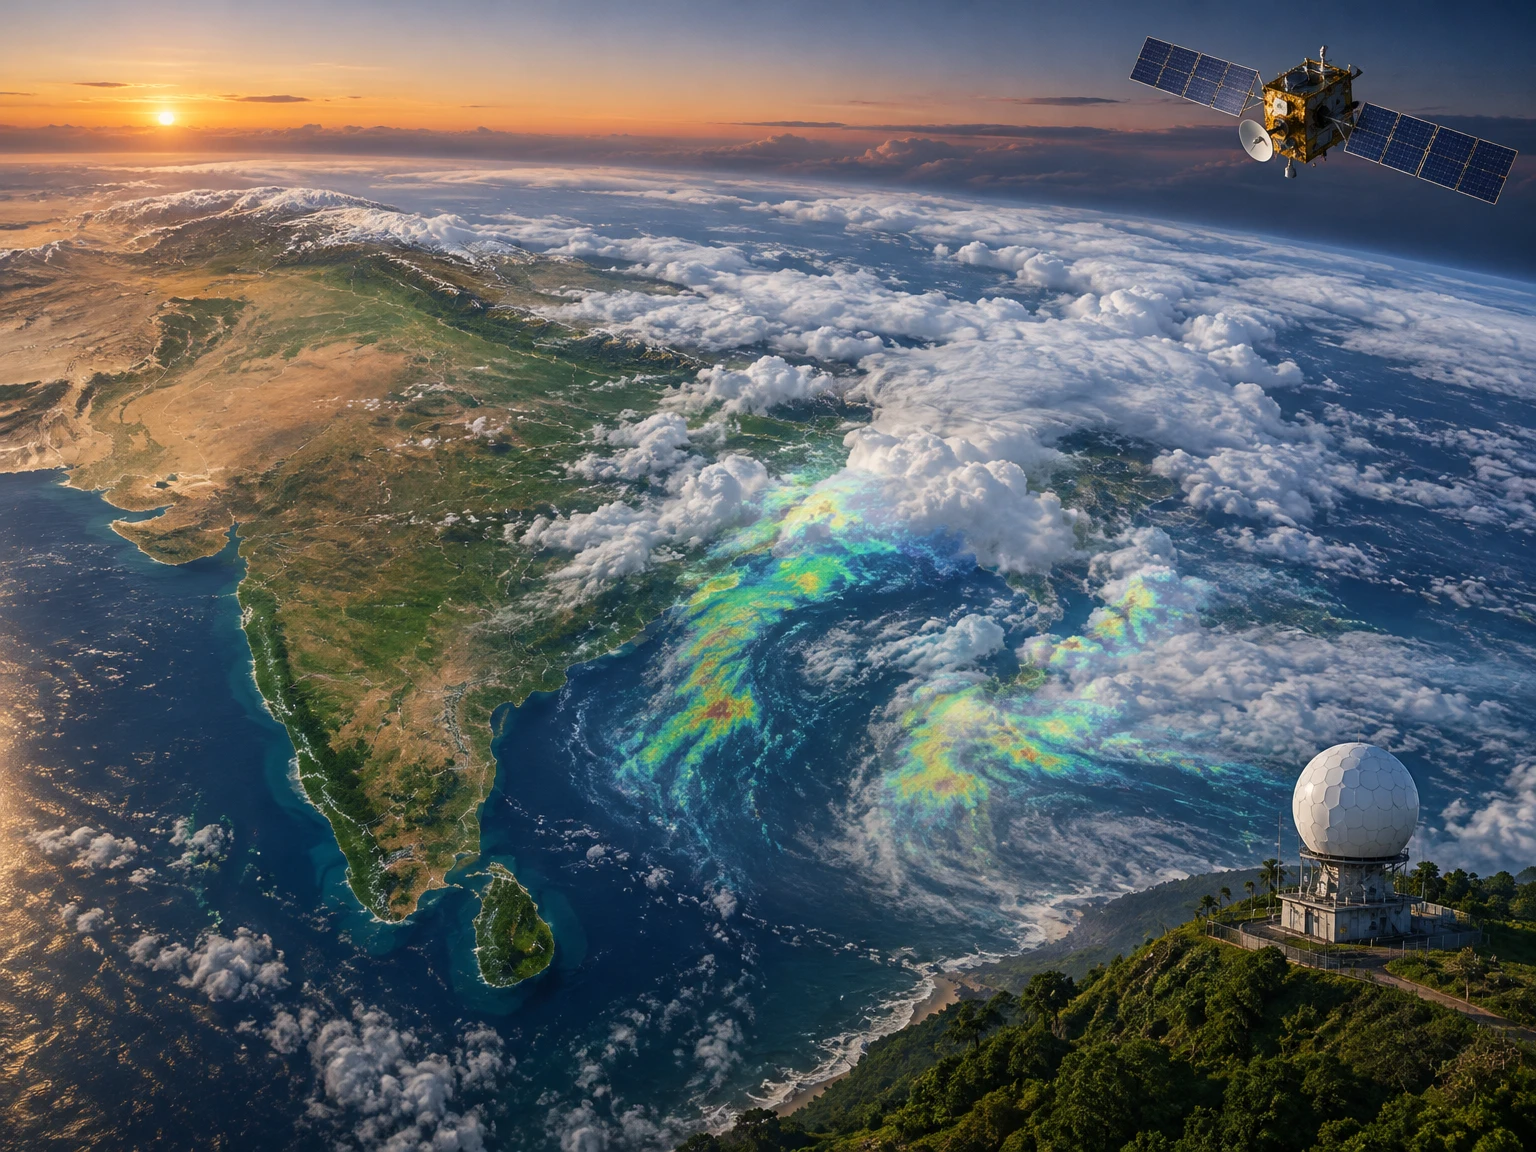
Weather forecasting is often imagined as a single prediction made by a computer. In practice, an Indian forecast is the result of a chain: observations are collected, checked and combined; numerical models estimate how the atmosphere may evolve; meteorologists compare model guidance with local conditions; and warnings are translated into information people can use. Satellites, Doppler weather radars, rain gauges, automatic weather stations, ocean observations and communication networks each reveal a different part of the picture. None can see everything, and no forecast is a promise. Understanding how these parts fit together helps explain why a forecast can change, why a district warning may be more useful than a national headline, and why the same rain system can create very different risks in different places.
1. Forecasting begins with a question
Before technology enters the picture, a forecast has to define what is being predicted, where, and for how long. “Will it rain?” is incomplete unless the place, time window, expected amount and decision are clear. A farmer deciding whether to irrigate needs a different answer from a commuter checking for an afternoon thunderstorm or an emergency manager preparing for river flooding. Forecast products therefore vary in scale and purpose: a seasonal outlook describes broad tendencies, a district bulletin gives a shorter planning horizon, and a nowcast may focus on a dangerous storm expected within hours.
These distinctions matter because atmospheric predictability changes with time. Small differences in the starting conditions can grow as a forecast looks farther ahead. A broad seasonal signal can be useful even though it cannot tell a household the exact day rain will begin. Conversely, a radar view may reveal a storm’s current movement but cannot by itself provide a reliable seasonal outlook. India Meteorological Department (IMD) products reflect these different needs, from short-range guidance and district rainfall forecasts to extended-range and seasonal outlooks. Choosing the right product is the first step in using the technology well.
2. The atmosphere is measured, not guessed
A numerical weather model needs a picture of the atmosphere at its starting time. That picture is assembled from observations made at many heights and locations. Surface weather stations measure variables such as temperature, pressure, humidity, wind and rainfall. Weather balloons carry instruments upward through the atmosphere, recording how those quantities change with height. Ships, buoys and aircraft contribute observations over oceans and along flight routes. Radar and satellites add broad coverage where ground stations are sparse or where conditions are changing quickly.
Every instrument has a field of view, a sampling interval and a margin of error. A rain gauge measures precipitation at one point; a nearby hill or neighbourhood may receive a different amount. A thermometer near a building may be warmer than one in an open field. A balloon samples a vertical column but not every place between launch sites. Forecasters and data systems have to assess whether an observation is plausible, timely and representative before it is used. Quality control is not a glamorous part of forecasting, but a faulty input can distort an analysis just as a faulty compass can mislead a map. More data are valuable when they add trustworthy information, not simply because the data count is larger.
3. What a weather satellite can see
Geostationary satellites remain above roughly the same region of Earth and repeatedly scan it, making them especially useful for watching clouds and evolving weather systems. IMD’s satellite services describe the use of INSAT-3D and INSAT-3DR observations for monitoring and forecasting. The instruments observe radiation in several spectral channels. Visible imagery resembles a photograph in daylight; infrared imagery measures emitted energy and can be used both day and night; water-vapour imagery helps show moisture patterns and atmospheric flow at higher levels.
Satellite images are not photographs of rainfall reaching the ground. A bright or cold cloud top can indicate tall, vigorous cloud, but cloud-top temperature alone does not say exactly how much rain fell beneath it. Analysts examine a sequence of images to estimate cloud motion, detect areas of rapid development and follow features such as tropical cyclones. IMD says satellite-derived winds and radiance values are supplied for assimilation into numerical weather prediction models, while satellite products also support monitoring of severe weather and cyclone development. Polar-orbiting satellite data contribute different views and measurements as they pass over the region. The strength of satellites is their broad, repeated view; their limitation is that they infer some surface conditions indirectly through clouds and atmospheric layers.
4. Infrared imagery works after dark
One useful satellite channel is infrared-1, which measures energy in a window near 10.8 micrometres. IMD’s satellite-services page explains that this channel provides measurements related to the temperature of the surface or cloud tops and is available around the clock. In a conventional black-and-white presentation, colder cloud tops generally appear brighter and warmer surfaces darker. This contrast helps analysts estimate cloud height and follow the movement of cloud features from one image to the next.
The word “generally” is important. Satellite brightness depends on the instrument, the channel, the surface and the atmosphere between the satellite and the target. A cold cloud top may be associated with deep convection, but the satellite does not directly measure the rainfall at a street corner. Storm intensity and rainfall estimates combine several clues and should be interpreted with other observations. Infrared images are especially valuable at night, when visible-light images are unavailable, but cloud layers can overlap and conceal lower-level structures. Satellite meteorology therefore relies on interpretation, calibration and comparison with ground reports—not on a simple rule that a bright patch equals a particular amount of rain.
5. Doppler radar adds local detail
A weather radar sends pulses of microwave energy and measures the signal scattered back by precipitation particles. The delay indicates distance, while the strength of the returning signal helps estimate how much precipitation is present. Doppler radar also measures how the returning signal changes in frequency, giving information about motion toward or away from the radar. That motion can reveal wind patterns inside a storm, including rotation or strong gusts, when the geometry and data quality permit.
Radar is particularly helpful for short-term monitoring because it can update much more frequently than many other observing systems and can show rain bands moving across a region. But radar does not observe every point equally. The beam rises with distance as Earth curves, terrain and buildings can block it, and the radar’s lowest view may overshoot shallow precipitation far away. Heavy rain, hail, ground clutter and technical outages can also complicate interpretation. A radar image is thus a measurement of the atmosphere within the radar’s coverage, not a photograph of every raindrop from ground level. IMD’s public service offers radar imagery alongside satellite and lightning information. Forecasters use these displays together with station reports, model forecasts and their knowledge of local geography.
6. Rain gauges and local stations ground the picture
Rainfall is one of the most important measurements for daily life, yet it is difficult to measure continuously over a vast and varied country. A gauge collects precipitation at a fixed site; a network of gauges shows how rainfall varies across a district or catchment. Automatic weather stations add regular measurements of temperature, humidity, pressure and wind. When many observations arrive promptly, they help identify whether a forecasted rain band is actually producing rain, how quickly conditions are changing and which model is closest to reality.
Coverage and representativeness still matter. A gauge in a town does not necessarily represent a steep upstream valley, an island or a coastal strip. Rainfall can vary sharply over short distances during thunderstorms. Some instruments require maintenance; communication may fail in severe weather; and observations need to be checked for quality and timing. Satellite-based estimates help fill gaps but are not identical to a gauge measurement. In practice, merging several kinds of evidence is more reliable than treating one source as definitive. The comparison between expected and observed rain also informs later forecasts: if a system is moving faster than anticipated, warnings may need to be updated. Measurement networks are therefore both the starting point for models and the means of checking them afterwards.
7. Numerical models turn observations into scenarios
Numerical weather prediction (NWP) divides the atmosphere into a three-dimensional grid. Equations describing motion, heat, moisture and pressure are calculated for each grid location and time step. The model receives an initial estimate of the atmosphere and applies those physical relationships to project how conditions may evolve. A finer grid can represent smaller features in more detail, but resolution alone does not guarantee accuracy. The model still needs good observations, realistic physics, enough computing power and careful evaluation.
Models simplify processes that occur at scales smaller than their grid cells. Individual cloud droplets, turbulent eddies and many local land-surface interactions cannot all be represented directly, so the model uses parameterizations—approximations that estimate their average effects. Different models use different equations, data sources and settings. Their forecasts can diverge, especially when a weather system is sensitive to small starting differences. That disagreement is useful information: it may show that confidence is lower or that more than one outcome is plausible. IMD’s website makes model guidance available alongside its own forecast bulletins and specialized services. The model is an important tool, but a forecast is not simply the output of one screen. Meteorologists interpret model guidance in light of observations, known model strengths and the decision at hand.
8. Data assimilation builds the model’s starting state
Observations do not arrive on a neat, simultaneous grid. A satellite scans over time; a balloon rises through different levels; a station reports from one location; radar samples a cone above the ground. Data assimilation is the mathematical process of combining these uneven measurements with a previous model estimate to create the best possible initial description of the atmosphere. The system weighs each observation according to factors such as its estimated error, location and timing, and compares it with what the model expected.
This is more subtle than copying observations into a map. If a single reading conflicts sharply with surrounding evidence, the system needs to determine whether it reflects a real small-scale feature, an instrument problem or a timing mismatch. Observations can influence nearby grid cells through the assimilation method, while the model’s physical relationships help maintain a coherent atmosphere. IMD describes providing INSAT-derived radiance and wind products to the National Centre for Medium Range Weather Forecasting for assimilation in NWP models. It also describes a GNSS network that estimates integrated precipitable water vapour at frequent intervals and provides data for forecasters and models. Better assimilation can improve the starting point, but it cannot eliminate uncertainty in future evolution or replace missing observations.
9. Forecasts are updated as evidence changes
A forecast is a time-stamped assessment, not a permanent fact. As fresh observations arrive, forecasters can compare them with the expected evolution of a system. If a storm forms earlier than models suggested, tracks change, or observed rainfall differs from the forecast, the assessment may be revised. This is normal: updating a forecast in response to new evidence is a sign that the system is monitoring reality, not a confession that science has failed.
Updates need to be communicated carefully. A person who read an earlier bulletin may not see a later change unless they check an official channel. Forecast services therefore publish bulletins, maps, warnings and specialized products at different intervals. The correct update cycle depends on the hazard. A cyclone, a fast-moving thunderstorm and a seasonal monsoon outlook do not evolve on the same clock. Historical forecast performance can be evaluated across many cases; one changed forecast cannot by itself establish whether the system is good or poor. For the public, the practical rule is to pay attention to the issue time and validity period printed on a bulletin, especially during severe weather. An old screenshot may still circulate after a warning has been replaced.
10. Forecast horizons answer different questions
IMD’s monsoon FAQ distinguishes several time scales. Short-range forecasts cover up to about three days; medium-range forecasts extend from roughly three to ten days. Extended-range products can look about ten to thirty days ahead, while seasonal outlooks describe broad expected rainfall patterns over a season. The exact product and definitions can vary by service, but the underlying principle is stable: the farther ahead the forecast, the more it tends to describe probabilities and broad patterns rather than precise local timing.
A nowcast is different again. IMD’s FAQ describes nowcasts for heavy monsoon rainfall with validity up to about six hours. That short horizon can be valuable for immediate decisions, such as taking shelter or pausing an outdoor activity, but it cannot replace preparation for a longer-term flood or drought risk. Seasonal forecasts can help public agencies and sectors plan, yet they do not tell an individual exactly when a storm will pass. Confusing horizons can lead to disappointment or unsafe choices—for example, treating a seasonal outlook as a daily rain timetable. The first question when reading a forecast should be: what period does it cover, and what level of detail does it support? That simple check prevents many misleading comparisons.
11. Ensembles and probability make uncertainty visible
Some forecasting systems run many versions of a model with slightly different starting conditions or assumptions. These are called ensemble forecasts. If the simulations cluster around a similar outcome, confidence may be higher; if they spread widely, several outcomes remain plausible. Ensembles can express uncertainty as a probability, but a probability needs context. A 60 percent chance is not a promise that rain will cover exactly 60 percent of a district, nor does it mean that rain must occur for a particular person. It describes likelihood under a defined forecast method and area.
Probability is useful because people face different costs when they act or wait. A farmer may take a modest precaution when rain is more likely than not; an emergency authority may need a stronger signal before ordering a costly evacuation. The threshold depends on the hazard, exposure and consequences. Forecast uncertainty also includes uncertainty in observations, model physics, initial conditions and the definition of the event itself. Communicating these limits is not a reason to ignore a forecast. It helps match action to risk. When a public bulletin expresses likelihood and impact, readers should consider both rather than relying on a single color, icon or number.
12. Warnings combine weather with consequences
A weather hazard is not the same as a disaster. The same amount of rain may be manageable in a well-drained area and dangerous in a low-lying settlement or a steep catchment. An impact-based forecast tries to connect expected weather with likely effects, such as waterlogging, transport disruption, crop stress or damage to exposed infrastructure. IMD’s public information describes impact-based forecasts and risk-based warnings at district level for hazards including cyclones, heavy rain, thunderstorms, heatwaves and cold waves.
That approach requires more than meteorology. Authorities need information about where people live, how roads and drainage are configured, which services are vulnerable and who may need support to act. Such exposure data can be incomplete or outdated, so a warning should not pretend to know every local outcome. The goal is to make risk information actionable: what may happen, where, when, how serious it could be and what protective step is appropriate. Meteorological agencies provide the forecast and warning; local authorities and emergency services translate it into local response. Residents should follow the instructions of relevant authorities, particularly during a declared emergency. A warning is not merely a prediction of bad weather—it is part of a wider chain intended to reduce harm.
13. Colors are a shorthand, not the whole message
Color-coded warnings can make a map easy to scan. IMD’s forecast procedure describes common stages in which green indicates no warning, yellow a watch or need to stay updated, orange an alert or need to be prepared, and red a warning to take action. The exact meaning depends on the hazard, the likelihood and potential impact, and the wording of the specific bulletin. Colors should therefore be read together with the text, location and validity period, not as a universal rating that means the same thing in every situation.
A district map may shade only part of a state, and a later bulletin may replace an earlier one. Someone living near a district boundary should check the location-specific detail rather than assume the nearest color applies exactly. A warning level also does not describe every personal circumstance: a person with mobility limitations, an exposed worksite or a flood-prone home may need to act earlier than a general audience. The point of a color is to help people notice the message quickly; the actual instructions are in the bulletin and in local guidance. When the risk is serious, a color alone is not enough information to decide where to go or which route is safe.
14. Public forecasts reach people through many channels
Forecasting has little value if the information does not reach the people who need it. IMD’s public site lists national and local forecast bulletins, subdivision and district rainfall products, cyclone and marine services, flash-flood bulletins, tourism forecasts, highway and railway forecasts, mountain weather bulletins and other specialized products. It also offers satellite, radar and lightning information. These products address different users and should not be treated as interchangeable. A marine bulletin is not a substitute for a district thunderstorm warning, and a national summary cannot provide the detail of a local forecast.
Mobile applications, websites, APIs, SMS and other distribution routes can broaden access. A government release on IMD services describes the MAUSAM app for forecasts and warnings, MEGHDOOT for agricultural meteorological services, DAMINI for lightning warnings, and UMANG as another access channel. Dissemination through multiple systems can help people receive information in familiar formats, but it also creates a responsibility to check source and timestamp. A forwarded message may have lost its date, location or validity period. People should prefer current official bulletins and local-authority instructions over screenshots stripped of context. Accessibility matters too: messages need clear language, local relevance and formats that work for people with different abilities and connectivity.
15. Agriculture needs more than a rain symbol
Agricultural decisions depend on timing, soil moisture, crop stage and local conditions, not only on whether a forecast says rain. A farmer deciding whether to sow, irrigate, spray or harvest may need information about rainfall probability, temperature, wind and the duration of wet conditions. A forecast that is useful for one crop or field may be less relevant to another. This is why specialized agrometeorological services can matter: they connect weather information to practical farm decisions while still leaving room for local judgement.
Short-range forecasts may support near-term work, while a longer outlook can help with planning. Neither should be treated as a guarantee. If rainfall is predicted but does not arrive at the farm, the farmer still has to rely on observed soil and crop conditions. Conversely, a general dry outlook does not mean that a localized storm is impossible. The best approach is to combine official forecasts with what is observed locally and to consider the cost of different choices. Forecast information can reduce avoidable losses when it is specific, timely and understandable; it cannot remove the natural variability of weather or the need for resilient farming practices.
16. Cities, roads and coastlines have different vulnerabilities
Urban rain can overwhelm drainage even when the total is not exceptional, particularly where surfaces are sealed and water has few paths to flow. Mountain roads may face landslides or rapid runoff; coastal communities may need to consider storm surge and marine conditions; rail and aviation operations depend on visibility, wind and precipitation. A single weather map can therefore conceal very different local consequences. Specialized transport, tourism and marine products exist because the same atmospheric system affects people and infrastructure in distinct ways.
Forecasts can help authorities stage crews, communicate diversions or protect exposed assets, but the forecast itself does not guarantee that a road is passable or a service is operating. Travelers need to check current notices from the transport operator and local authorities as well as weather bulletins. In coastal settings, wind and sea conditions can change the safety of fishing or boating even when rainfall is limited. In hill regions, access restrictions may be imposed for reasons that are not captured by a weather forecast alone. Weather information is one input into a safety decision; site-specific instructions and current conditions remain essential.
17. What forecast accuracy can and cannot mean
“Accurate” can refer to several things: whether rain occurred, how much fell, where a storm travelled, or whether a warning arrived in time to support action. A forecast can correctly identify a broad hazard but miss its precise start time; it can predict rain for a district but not every neighbourhood. A single hit or miss cannot measure the quality of a system. Verification requires many forecasts, clear definitions of the event and fair comparison with an appropriate baseline.
Forecast improvements are cumulative. Better instruments can improve observations; faster communications can shorten the delay before data reach forecasters; models and computing can represent atmospheric processes more effectively; training and evaluation can improve interpretation; and warning design can help people act. Yet fundamental limits remain. The atmosphere is dynamic, observations are incomplete and local impacts depend on geography and human systems. A forecast should be judged by its stated scale and purpose. It is not reasonable to demand street-by-street certainty several days ahead, but it is reasonable to expect clear validity times, transparent uncertainty and correction when new evidence changes the assessment. Measuring usefulness also asks whether people received and understood the warning—not only whether a model score improved.
18. Practical habits for reading a forecast
Start by identifying the issuing source and the time the bulletin was published. Then check the place and period it covers. Distinguish a probability from a certainty, and look for the expected hazard and its possible impacts. If a map uses colors, read the accompanying explanation. During rapidly changing weather, check for later updates rather than relying on a saved image. For a decision involving travel, work or an outdoor event, consider the consequences of being wrong in either direction and consult the relevant authority or service provider.
Do not infer that an entire state will experience the same conditions from a statewide headline. Nor should a lack of rain at one observation point be taken as proof that a wider warning is false. Forecasts describe an area and time window, while local conditions can differ. If instructions are issued for evacuation, shelter or avoiding a route, follow the official local guidance. For routine planning, a forecast can guide choices without dictating them: carry protection, allow extra travel time or postpone a risky activity when the potential cost is high. These habits make a sophisticated forecasting system more useful in ordinary life.
19. The next frontier is integration, not a magic app
Forecasting continues to evolve through more satellite observations, denser surface networks, improved radar coverage, faster data exchange, better models and more tailored public products. Artificial intelligence and machine learning can help identify patterns, process large data sets or produce guidance, but their usefulness depends on reliable training data, careful testing and clear limits. A new method must be evaluated across different seasons, regions and hazards; a model that performs well in one setting may not transfer automatically to another.
Local forecasts also depend on the quality of maps and exposure information used to explain impacts. Better technology cannot by itself repair a broken rain gauge, ensure a warning reaches every household or guarantee that people have a safe place to go. Progress should be judged not only by finer grids or faster computers but by whether warnings are more reliable, understandable, accessible and actionable. Public trust grows when agencies explain what is known, what remains uncertain and when an update is expected. The future of forecasting is therefore a combination of science, engineering, institutions and communication—not a single app or algorithm that can promise certainty.
Conclusion: technology supports judgement
India’s weather forecasts emerge from many layers of evidence. Satellites provide a broad, repeated view; radar reveals precipitation and motion in its coverage area; stations, gauges, balloons, ships and other observations measure conditions more directly; data assimilation combines them into an atmospheric starting state; and numerical models project possible futures. Meteorologists evaluate those outputs, while warning systems connect forecasts to decisions and public communication. Each layer improves the picture, and each has limits.
Readers can make better use of forecasts by matching the product to the decision, checking its issue time and validity, reading the full warning rather than only its color, and following local instructions during hazards. Forecasts are most valuable when treated neither as infallible promises nor as guesses to ignore, but as evidence-based guidance that changes when the atmosphere reveals more. Technology helps people prepare; informed judgement and timely action complete the chain.
Sources and further reading
- India Meteorological Department, Satellite Services: https://mausam.imd.gov.in/imd_latest/contents/satmet.php
- India Meteorological Department, Satellite Services (Infrared-1): https://mausam.imd.gov.in/responsive/satellite.php
- India Meteorological Department, Monsoon FAQ: https://mausam.imd.gov.in/imd_latest/monsoonfaq.pdf
- India Meteorological Department, Standard Operating Procedure for Forecasting: https://mausam.imd.gov.in/imd_latest/contents/pdf/forecasting_sop.pdf
- India Meteorological Department, official public forecast portal: https://mausam.imd.gov.in/index_en.php
- Press Information Bureau, Government of India, “IMD’s indigenous, technology-driven and citizen-centric weather forecasting systems” (government description of services): https://www.pib.gov.in/PressReleasePage.aspx?PRID=2288238®=1&lang=1
This content is a collection of ancient history,books and various articles and collection of library and news and other post ; all details may not be the same. Readers are requested to verify the information themselves. Readers are not allowed to take any disciplinary action; content is only for educational purposes. If readers do not agree about the contents, they may send a personal comment to my personal email ID: achary.purna@gmail.com
