
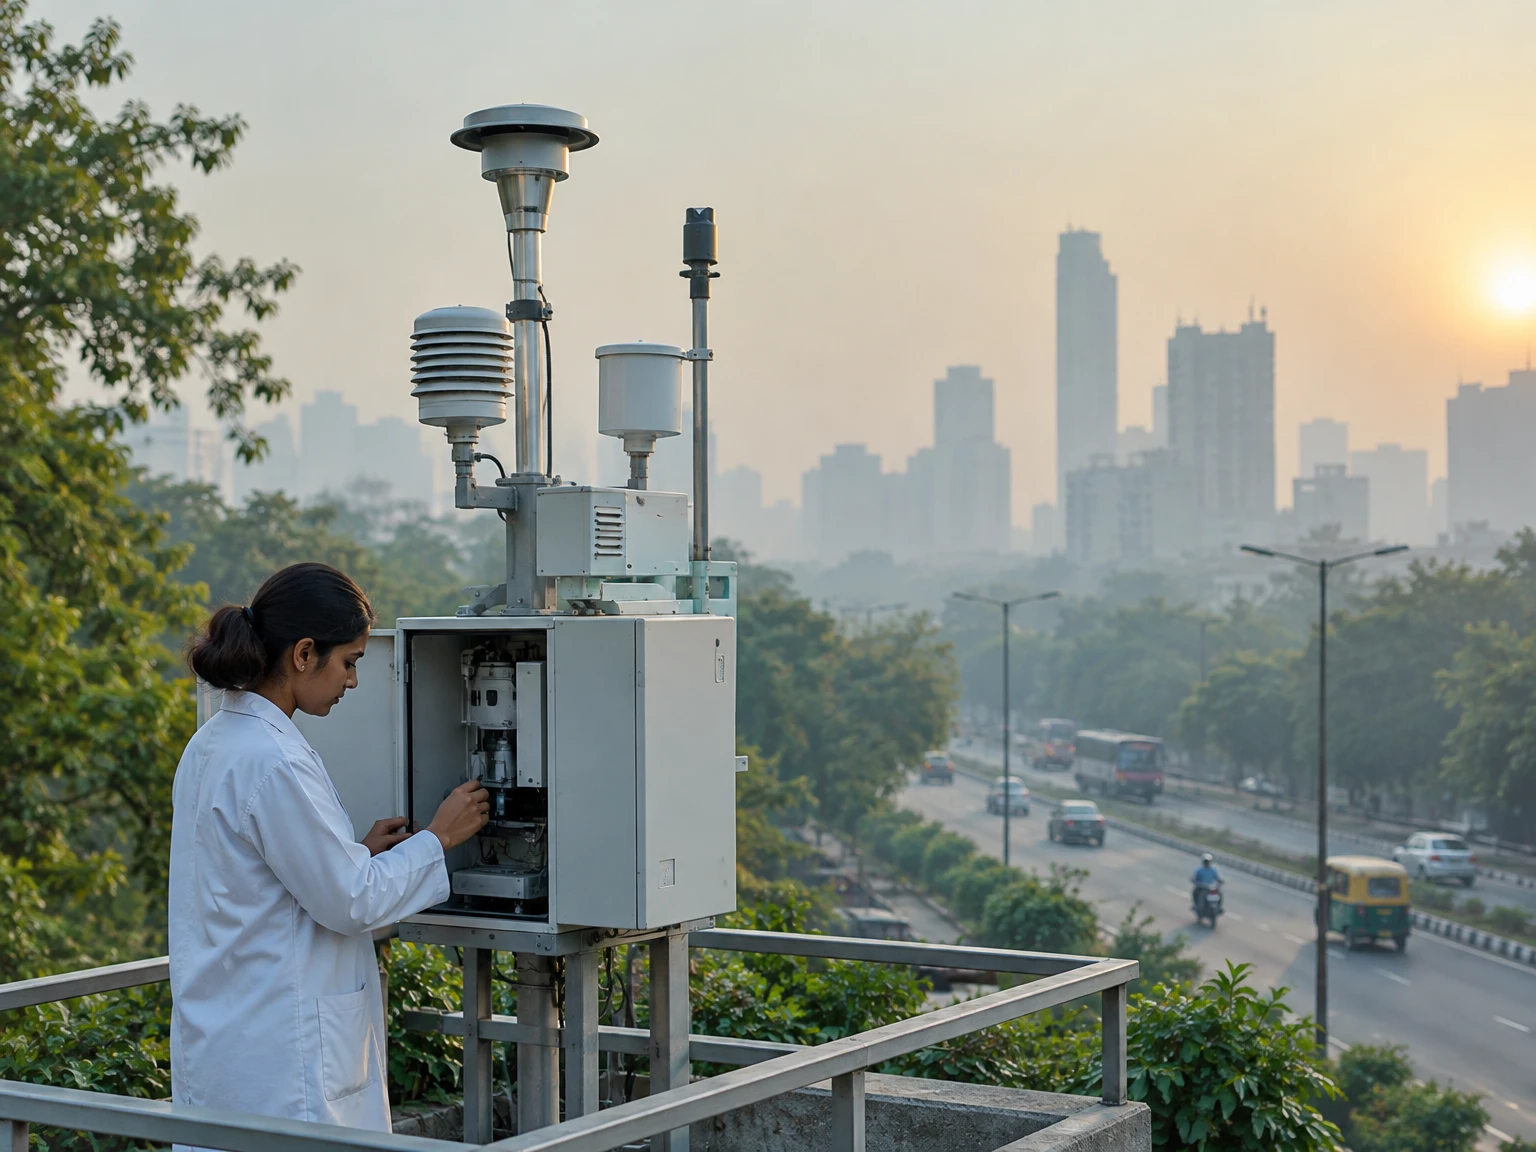
Air quality reports often reduce a complicated set of measurements to one number, a colour and a short label. That number is useful because it gives people a quick way to understand a current reading without studying a table of gases and particles. It is also easy to overread. The number is not a literal percentage of clean air, a direct measurement of every pollutant, a forecast for every street, or an individual medical diagnosis. To interpret it well, ask what system produced it, which pollutant is driving it, where and when the measurements were taken, and whether the data are complete.
India’s National Air Quality Index, or AQI, is designed to communicate ambient air quality in accessible terms. The Central Pollution Control Board (CPCB) describes six categories, from Good through Severe, based on pollutant concentration breakpoints and associated likely health impacts. The technical method matters: it calculates pollutant-specific sub-indices and uses the highest qualifying sub-index as the overall AQI. This makes the result a practical warning signal, but also means the overall value tells only part of the story. The following guide explains the number, its limits and the questions that make an air-quality report more useful.
1. An index is a translation, not a new measurement
Monitoring instruments measure concentrations of pollutants in the surrounding air. Depending on the instrument and pollutant, results may be reported in micrograms per cubic metre, milligrams per cubic metre or another concentration unit, with a defined averaging period. An index transforms those readings into a standardised scale and a label. It helps answer a public-information question such as “how polluted is the monitored air in this place and period?” It does not replace the underlying measurements. When a dashboard provides the AQI, pollutant-wise readings, station name and update time, those details help explain what the headline number means.
The scale is designed for communication and comparison within its own rules. A reading of 150 is not “30 percent polluted,” and an AQI of 200 is not twice the personal exposure associated with an AQI of 100. The index is not a direct dose measurement. Exposure also depends on where someone spends time, how long they are there, activity, indoor conditions and the mixture of pollutants. Treat the number as a structured summary of monitored ambient conditions, not as a precise measure of what entered any one person’s lungs.
2. The Indian National AQI categories
CPCB’s published National AQI material lists six bands: Good, 0–50; Satisfactory, 51–100; Moderate, 101–200; Poor, 201–300; Very Poor, 301–400; and Severe, 401–500. Some documents use slightly different wording for the middle category, such as “Moderately polluted.” The band gives a concise description of the index result. The CPCB page also associates the categories with health-impact statements, ranging from minimal impact in the Good band to possible respiratory effects for healthy people and more serious impacts for people with lung or heart disease in the Severe band.
These descriptions are general population communications, not promises that every person will feel a particular symptom. People differ, and an index category does not establish a diagnosis or predict an individual outcome. Category thresholds also belong to a particular AQI system. A number in one country’s index cannot automatically be matched to the same number in another country’s index because pollutant breakpoints, averaging periods, included pollutants and aggregation methods may differ. When using a colour-coded app, check which index it uses before comparing its labels with CPCB’s Indian scale.
3. Which pollutants can enter the calculation?
The Indian scheme covers eight pollutants with short-term standards in its breakpoint tables: PM10, PM2.5, nitrogen dioxide (NO2), sulphur dioxide (SO2), carbon monoxide (CO), ozone (O3), ammonia (NH3) and lead (Pb). PM10 and PM2.5 are particulate matter grouped by aerodynamic size; the number describes a size fraction, not a chemical ingredient. The other entries are gases or, in the case of lead, a toxic metal that may be measured through a different sampling process. They come from different sources and can behave differently in the atmosphere.
Not every monitoring station measures all eight pollutants, and not every pollutant is available at the same frequency. CPCB’s technical documentation says the overall index is calculated when data are available for at least three pollutants, including PM2.5 or PM10; it also describes a minimum data-completeness requirement for the calculation. The exact data shown by a live service can depend on the station, instrument, time window and reporting system. If a monitor does not measure a pollutant, the blank does not mean the pollutant is absent. It means that the particular source has not provided a measurement for it.
4. From concentration to a sub-index
Each pollutant has concentration breakpoints associated with AQI values. For a measured concentration that falls between two breakpoints, the scheme maps it to a sub-index within the corresponding range, commonly using a segmented linear relationship. In plain language, the calculation asks where the measured concentration sits between the lower and upper concentration limits, then maps that position to the lower and upper index values. This lets different pollutants, which use different physical units and concentration scales, be represented on one common index scale.
That conversion is not arbitrary, but its thresholds encode policy and evidence choices. CPCB’s technical report explains that the breakpoints draw on national ambient standards, health evidence and expert review. Its tables use 24-hour averages for several pollutants and 8-hour values for CO and ozone; the underlying pollutant matters when reading a result. A single instantaneous sensor value should not be mistaken for a completed 24-hour average. A dashboard can show running averages or preliminary updates, so read its timestamp and method notes rather than assuming that every displayed value represents the same period.
5. Why the highest pollutant sub-index sets the headline
After pollutant-specific sub-indices are calculated, the National AQI uses the maximum, or worst, qualifying sub-index as the overall value. The pollutant responsible for that maximum is often called the prominent or responsible pollutant. If particulate matter produces the highest sub-index, it drives the reported AQI even if other monitored pollutants have lower sub-indices. This approach is meant to avoid hiding a high reading for one pollutant inside an average of several lower readings. It also gives the public a clue about which pollutant is contributing most to the result.
The trade-off is that the headline is not a complete ranking of every pollutant or a summary of their combined effects. The CPCB report discusses the reason for selecting a maximum-operator approach and notes that combined pollutant effects are complex. If two pollutants are close to the maximum, small changes in concentration or averaging windows may change which one is listed as the driver while the overall category remains similar. When the pollutant name is missing from a card or screenshot, look for station-level details in the underlying dashboard. Without them, the single AQI number does not reveal what specifically drove it.
6. Averaging time changes what a number describes
Air concentrations rise and fall over minutes, hours and days. A concentration measured over one hour answers a different question from a 24-hour mean. Shorter periods can capture rapid changes; longer averages smooth out brief spikes but may hide them. The Indian AQI uses pollutant-specific periods in its technical scheme: several pollutants use 24-hour data, while carbon monoxide and ozone use 8-hour values in the published breakpoint tables. The time period is part of the meaning of the result, not a minor footnote.
Live dashboards sometimes update a running average, where each new reading changes the current value while the window moves forward. A page may display a clock time even though the underlying result reflects many preceding hours. A station with manual sampling may report less frequently and with a delay. Therefore, two posts bearing the same calendar date can represent different measurement windows or update times. Before concluding that air quality improved or worsened, compare like with like: the same station or clearly comparable location, the same averaging period, the same index system and similar data completeness.
7. A station reading is not a map of every street
A monitoring station represents air measured at its location and under its operating conditions. It is evidence about the surrounding area, but it cannot measure every road, building courtyard, school gate or indoor room. Traffic, construction, cooking, industry, local winds, land cover and street geometry can produce small-area differences. A citywide number may be built from multiple stations or a reporting method; it should not be read as a promise that every neighbourhood has exactly that concentration.
When comparing two places, identify the station names and locations, then consider whether the monitors are near similar sources and land uses. One roadside monitor and one suburban monitor may capture different environments even on the same day. A change in the mix of stations reporting can also affect an aggregate dashboard. The fact that one station’s index is higher does not, by itself, prove why the difference occurred or identify a source responsible for it. It provides a measurement pattern that may guide further investigation, not a complete source-apportionment study.
8. Data completeness and missing readings
Instruments need calibration, maintenance and quality checks. Data may be missing because a station is offline, a measurement failed, a pollutant is not monitored there or the minimum reporting period has not yet been met. A robust index needs enough valid pollutant data for the calculation rules to apply. CPCB’s scheme documentation describes conditions for a valid aggregate result, including a minimum number of pollutants and a particulate-matter reading. When the required data are insufficient, a responsible system should report that limitation rather than manufacture a complete score.
Missing data are not equivalent to zero pollution. Nor does a populated chart automatically mean every series is equally reliable or complete. Check whether the source labels a value real-time, provisional, delayed, insufficient or unavailable. If an app does not show a responsible pollutant or station, that omission may reflect how the app presents its data rather than a technical conclusion that there is no dominant pollutant. The safest interpretation is bounded: this source reports this result for this station and time, under its published method. Do not fill gaps with guesses or treat silence in a dashboard as evidence that the air is clean.
9. AQI, ambient standards and WHO guidelines are different tools
An AQI category is not the same thing as a legal ambient air-quality standard. Standards specify concentration limits and averaging periods adopted by a regulatory authority for particular pollutants. An index transforms certain measurements into a communication scale. The same pollutant can have multiple standards for different averaging periods and uses, while the AQI focuses on a particular set of short-term health communication thresholds. A category therefore cannot replace checking the pollutant concentration, standard and averaging period relevant to a technical or legal question.
The World Health Organization’s Global Air Quality Guidelines are another kind of reference. WHO describes them as evidence-based health recommendations for key pollutants, intended to help governments and others reduce exposure; they are not legally binding standards by themselves. WHO’s 2021 update provides guideline levels and interim targets, and its health summaries emphasize that particulate matter can penetrate deeply into the lungs, with PM2.5 capable of entering the bloodstream. A WHO guideline value, a national legal limit and a national AQI band can all be useful, but they answer different questions. Do not compare their raw numbers as if they were interchangeable scales.
10. What PM2.5 and PM10 tell us—and what they do not
PM10 includes particles with aerodynamic diameter of 10 micrometres or less, while PM2.5 refers to the finer fraction of 2.5 micrometres or less. PM2.5 is contained within the broader PM10 fraction; the categories are not two separate substances that can simply be added together. The particle mass measurement does not identify every chemical component or its source. Depending on place and time, particles can come from combustion, road and construction dust, industrial processes, natural material or atmospheric reactions that create particles from gases.
Because fine particles can travel deeply into the respiratory system, health agencies pay particular attention to PM2.5. That does not mean larger particles are harmless or that the PM labels alone describe toxicity. Composition, dose, exposure time and a person’s health all matter. A single AQI number that is driven by PM2.5 still does not say where each particle originated, whether indoor air matches outdoor air or what a particular person experienced. Source identification generally needs additional monitoring and analysis, not just the one index value.
11. Why the responsible pollutant can change
The dominant sub-index can change from day to day, even at one station. Weather affects how pollutants disperse, react and settle. Wind direction and speed can move emissions; sunlight can support ozone formation; temperature and atmospheric mixing influence whether pollutants remain near the ground or disperse upward. Rain can remove some particles from the air temporarily, while dry conditions may resuspend dust. These processes interact with emissions from transport, power generation, industry, household activity and other sources.
A shift in the listed responsible pollutant does not necessarily mean one source suddenly disappeared or a new source began. It may reflect weather, a changing emissions mix, the averaging period, data availability or a pollutant crossing another pollutant’s sub-index. A single reading cannot establish causation. To investigate a trend, use a consistent series of measurements, meteorological context and, where available, source-specific research. An index is useful for signaling a condition; it is not a substitute for the fuller environmental analysis needed to explain why that condition occurred.
12. Health statements are general, not personal medical instructions
CPCB’s categories include broad descriptions of likely health impacts. These help translate technical measurements into public information, but they are not a clinical assessment. People with asthma, heart or lung disease, children and older adults may be more sensitive to air pollution, yet individual responses vary. A person can experience symptoms at different conditions, and the absence of symptoms does not prove that exposure has no health effect. The index cannot determine whether a specific symptom was caused by air pollution.
For personal decisions, follow current advice from public-health authorities and a clinician who knows your circumstances. If a local authority issues an alert or official protective guidance, use that guidance rather than relying on a generic article or a third-party app alone. Avoid turning a category into a rigid medical rule—for example, the index by itself cannot decide whether a person should change prescribed treatment or skip essential care. This explainer is educational and cannot replace professional medical advice. Its purpose is to help readers understand the public indicator and its limits, not to prescribe an individual response.
13. How to compare readings responsibly
Start with the source and the station. Is the value from CPCB, a state pollution-control board, a research network or a commercial app? Does the source explain whether it uses India’s National AQI or another system? Identify the measurement location, update time, responsible pollutant and averaging window. If you are comparing readings, make sure the same conditions apply. A different station, time window or index formula can create different numbers without either display necessarily being wrong.
Next, inspect the pollutant-level data and data-quality notes. Is the overall value based on enough measured pollutants? Is one pollutant clearly driving it? Are individual readings listed in concentration units as well as index values? Is a station marked offline or reporting a delayed/manual sample? These details help distinguish an informative measurement from a simple headline. If critical metadata are missing, report the result carefully: name the source and time, and say that the station or averaging period is unclear. A qualified statement is more useful than false precision.
14. What the AQI can support in public discussion
Repeated measurements can help describe patterns, identify times when air quality is worse, and support public discussion about monitoring and pollution-control efforts. The index’s purpose is to make information more accessible so people and decision-makers can understand ambient conditions. A series showing that a pollutant repeatedly drives a high index can justify asking for better source information, enforcement data or a time-bound plan. It can also help communities explain why transparent monitoring and readable public data matter.
But an index alone cannot prove that a particular factory, road, construction site or policy caused a reading. It cannot rank the responsibility of different sources without additional analysis. It cannot establish a legal violation unless the relevant standard, sampling method, period, location and official procedure are also considered. And it cannot guarantee that one neighbourhood’s air is identical to the city aggregate. Use AQI as one piece of evidence, alongside pollutant measurements, weather records, monitoring coverage and official reports. This keeps public claims informative without overstating what the number proves.
15. A quick reading checklist
When an AQI appears in a weather app, news report or city dashboard, ask five questions. First, which system and category scale does the number use? Second, where is the monitor, and is the result station-specific or aggregated? Third, what is the responsible pollutant, and what concentration was measured? Fourth, what averaging period and update time are shown? Fifth, does the source say the data are complete, valid and current, or does it include a caveat?
If those answers are available, the index becomes much more interpretable. If they are missing, do not infer them. A low number from one station cannot guarantee identical conditions everywhere; a high number does not name a source or diagnose an individual. Use the reported category as a quick signal, then consult pollutant-wise readings and official guidance for the context that matters. The checklist is deliberately simple because the value of an index is clearest when its supporting information remains visible.
Conclusion: keep the number attached to its context
India’s National AQI turns selected pollutant measurements into an accessible scale, with the highest qualifying pollutant sub-index setting the overall result. Its six categories help communicate ambient conditions and likely health impacts, while pollutant-specific details explain what is driving the headline. A good reading of the index also respects its boundaries: monitors sample particular places, measurements use defined time windows, not all pollutants are available everywhere, and a public index is not an individual exposure or diagnosis.
Whenever possible, read the AQI with its station, time, responsible pollutant, concentration and data-quality notes. Keep national standards, WHO health guidelines and index categories distinct. Use the information to understand and discuss monitored conditions, while leaving source attribution, legal conclusions and personal medical decisions to the evidence and expertise those questions require. The result is a more useful public conversation: one that values clear information without asking a single number to say more than it can.
Sources and further reading
- Central Pollution Control Board, “About National Air Quality Index”: https://cpcb.gov.in/displaypdf.php?id=bmF0aW9uYWwtYWlyLXF1YWxpdHktaW5kZXgvQWJvdXRfQVFJLnBkZg==
- Central Pollution Control Board, “National Air Quality Index” technical report: https://cpcb.gov.in/displaypdf.php?id=bmF0aW9uYWwtYWlyLXF1YWxpdHktaW5kZXgvRklOQUwtUkVQT1JUX0FRSV8ucGRm
- Central Pollution Control Board, National Air Quality Index portal: https://cpcb.nic.in/naqi/
- World Health Organization, “WHO Global Air Quality Guidelines: Questions and Answers,” 22 September 2021: https://www.who.int/news-room/questions-and-answers/item/who-global-air-quality-guidelines/
- World Health Organization, “What are the WHO Air quality guidelines?”: https://www.who.int/news-room/feature-stories/detail/what-are-the-who-air-quality-guidelines
This content is a collection of ancient history,books and various articles and collection of library and news and other post ; all details may not be the same. Readers are requested to verify the information themselves. Readers are not allowed to take any disciplinary action; content is only for educational purposes. If readers do not agree about the contents, they may send a personal comment to my personal email ID: achary.purna@gmail.com
