
Reading a Mangrove Estuary as a Living System
Bhitarkanika is often introduced through its wildlife or its distinctive waterways, but its mangrove forest is best understood as a system of connections. Land drains toward rivers and creeks; freshwater meets saline water; tides carry sediment and organic matter; plants, animals and people all encounter a landscape that changes with the water. The word “estuary” describes that meeting place, not a fixed boundary visible on every map. A creek can look narrow at one hour and broad at another, while the muddy bank beside it may be submerged, exposed or reshaped. That dynamic setting helps explain why the forest cannot be reduced to a collection of trees or a scenic backdrop. Its ecological character depends on the movement of water and material across a wider coastal plain. This article draws on public institutional sources and a peer-reviewed spatial study. It distinguishes recorded descriptions from modelled scenarios, and older inventories from present-day measurements, because those forms of evidence answer different questions.
The name Bhitarkanika is used for related but not always identical geographies: a national park, a wildlife sanctuary, a Ramsar wetland and the broader mangrove landscape studied by researchers. Those boundaries and purposes should not be casually treated as interchangeable. The Ramsar Sites Information Service lists Bhitarkanika Mangroves as site 1205, designated on 19 August 2002, with a recorded area of 65,000 hectares. Its information sheet is a historical site record, not a live ecological census. A 2022 research paper, meanwhile, examines a mapped coastal study area spanning administrative units in Kendrapara and Jagatsinghpur districts. Its estimates belong to that study’s chosen extent and methods. In any discussion of area, species or carbon, naming the geography and date matters. Numbers with different boundaries, years or definitions may both be correct within their own scope, yet cannot be compared as if they described the same patch at the same moment.
Public descriptions of mangroves sometimes speak of a single forest, but a coastal mangrove landscape contains gradients. Freshwater influence, tidal access, sediment texture, elevation and exposure to waves vary from one location to another. Those differences affect which plants can establish and how long roots remain immersed. The resulting vegetation is not necessarily uniform even where the canopy looks continuous from a distance. Creeks, channels, mudflats, forest edges and inland transitions form part of the habitat mosaic. A map that colors an area “mangrove” may be useful for broad comparisons, but it compresses many ecological distinctions into one category. Field observations can reveal finer detail, while satellite data can survey larger areas consistently. Each method has strengths and blind spots. A careful reading therefore asks what the map classifies, at what scale, on what date, and how the researchers checked it against conditions on the ground.
Why Mangroves Can Live Between Land and Sea
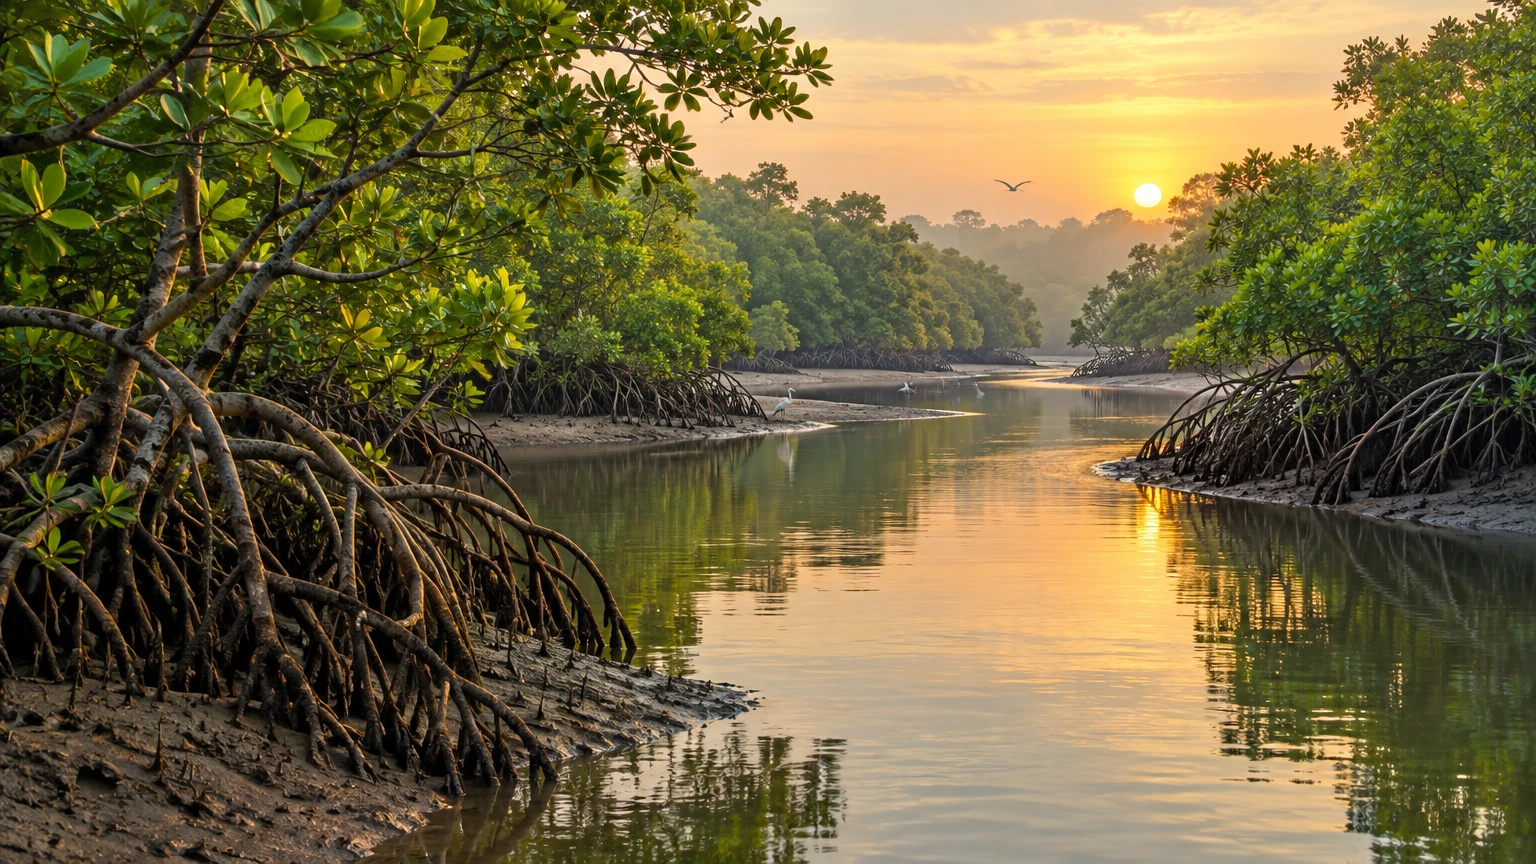
Mangroves are woody plants adapted to coastal environments where ordinary terrestrial roots would face a difficult combination of waterlogging, unstable sediment and salt. The Odisha Forest Department’s pictorial guide describes adaptations associated with saline water, soft substrates and oxygen-poor soils. Many mangrove species develop conspicuous roots that help support the plant, exchange gases or tolerate inundation; the exact form and function differ among species. Some roots rise above the mud, while others spread outward or arch from stems. Their visible shapes are not simply decorative. They are part of how plants persist where the ground is periodically flooded and the soil’s air supply is limited. But not every root system performs every function in the same way, and a general account of mangrove adaptations should not be mistaken for a species-by-species field guide to Bhitarkanika. Local identification requires reliable botanical records and careful observation.
Salt creates another challenge. Mangrove plants differ in how they manage salt uptake, exclusion or accumulation, and the strategies vary across species. A general adaptation does not imply that every mangrove tree can thrive in seawater of any salinity. The balance between freshwater inputs, tidal exchange and evaporation shapes local conditions; so do season and weather. A change in one part of the water system may alter the conditions experienced elsewhere, though the effect depends on location and timing. This is why simple slogans such as “mangroves love salt” conceal more than they explain. They are coastal specialists, not plants indifferent to water quality or hydrology. The Odisha Forest Department guide offers an accessible introduction to this ecology, while the Ramsar record supplies a dated site profile. Neither replaces repeated field measurements across the landscape. Readers should treat broad biological descriptions as context, not as proof of a present-day condition at a particular creek.
Reproduction is also adapted to a shifting shore. Many mangrove plants produce propagules that can develop while still attached to the parent plant and later disperse through water. Their shape and buoyancy help them travel or settle, depending on species and conditions. Dispersal is not a guarantee of successful establishment: a propagule must encounter a suitable place, remain there long enough and survive competition, disturbance and changing water conditions. This makes the link between creek movement and forest renewal more complex than the idea that seeds simply float wherever tides take them. A broad distribution pattern may reflect hydrology, local habitat and historical disturbance together. The life cycle also reminds us that mangroves are not static stands. Forest composition can change over time through recruitment, mortality and shifting environmental conditions. To understand those changes, researchers need repeated observations rather than a single photograph or one-time species list.
The physical structure of a mangrove forest creates many small-scale habitats. Roots and trunks can interrupt water movement, provide attachment surfaces, shelter small animals and influence how organic material settles. Creeks connect these sheltered spaces to open channels and other parts of the estuary. The resulting habitat may support organisms using different parts of the water column, sediment and vegetation. This is a description of ecological mechanisms, not a claim that every species is present in every creek. Species records require an identified survey, date and method. A site description written in 2002 cannot substitute for current monitoring; a field observation from one season cannot describe all seasons. In the same way, a photograph of exposed roots is an illustration of form, not a measurement of ecosystem condition. A responsible account of Bhitarkanika’s living system should make room for these distinctions, especially when public interest in wildlife can encourage broad claims without an accompanying evidence trail.
Sediment, Nutrients and the Estuary’s Food Web
Rivers carry freshwater, suspended particles and dissolved substances toward the coast. Tides move water in and out of estuarine channels, and the interaction between river flow and tides influences where sediment settles, where it is resuspended and how nutrients travel. Mangrove roots and trunks can alter water movement locally, slowing some flows and creating conditions in which particles may deposit. These processes are variable: the direction and strength of water movement, the amount of sediment available and the shape of the channel all matter. It would be misleading to promise that mangroves always stop erosion or that planting trees anywhere will restore a shoreline. Coastal change has multiple causes, and a root system’s effect depends on context. Understanding the estuary means looking at its connections with the catchment, river, tidal channels and coast, rather than assigning every change to one vegetation type.
Organic matter from leaves, roots and other sources can become part of the sediment and food pathways. Microbes and small organisms transform material; some is consumed within the estuary, some is transported, and some becomes buried. This movement is one reason mangrove ecosystems are discussed in relation to carbon storage. Carbon accounting depends on what pools are measured: living biomass, dead wood, litter, roots and soil can each matter, and the depth or method of soil sampling affects the result. A total cannot be interpreted without its study boundary, components and time frame. The 2022 Bhitarkanika-area study estimated carbon stocks for specified pools across its mapped extent; those are research estimates, not a current public inventory of every forest compartment. Different studies may report different values because they use different definitions, data or boundaries. The scientifically useful question is not which single number sounds largest, but what evidence supports each estimate and how comparable the methods are.
Nutrient cycling also crosses ecological boundaries. Water can carry nitrogen and phosphorus into or out of wetlands, and the amounts may vary with season, land use, hydrology and sampling location. Nutrients support biological productivity, but excess loading can have harmful effects in some waters; the direction and scale of a change need local evidence. The 2022 paper models nutrient export under alternative land-cover scenarios, using its study design and assumptions. Its outputs should not be restated as directly measured current flows or as guaranteed consequences of future policy. A model helps explore relationships and compare possible pathways; it does not watch the future unfold. Readers can learn from the relative patterns among scenarios while keeping the conditions attached to them in view. Any claim about present nutrient levels, pollution or water quality would need measurements and a source that identifies where and when samples were collected.
The estuary’s ecological roles are often described with words such as nursery, buffer or carbon sink. These terms can be useful shorthand, yet they require care. A nursery role refers to habitat that supports early life stages or contributes to the broader life cycle of organisms; establishing that role for a species usually requires ecological evidence, not merely the presence of vegetation. A buffer can mean that vegetation changes exposure or flow under specific conditions; it does not mean a forest makes nearby settlements invulnerable to storms. Carbon storage refers to carbon held in particular pools at a given time; it does not automatically prove that every area is a net sink in every year. The Ramsar information sheet gives a broad ecological description of the wetland, but it dates from 2002. These concepts can frame questions for research and conservation without being overstated as universal guarantees.
What a Spatial Study Can—and Cannot—Tell Us
A spatial study brings observations together across a defined area. The 2022 peer-reviewed paper by Kadaverugu and colleagues examines ecosystem services and land-use scenarios for the Bhitarkanika mangrove landscape. It combines mapped information with modelling and stakeholder inputs. The authors describe a study extent across administrative units in Kendrapara and Jagatsinghpur; it is not simply the same thing as the Ramsar site boundary. Their baseline mapping refers to conditions around 2020 and reports approximately 194 square kilometres of mangrove cover within their study framework. The paper’s estimate should be cited with that scope, rather than repeated as a current 2026 measurement or as the total area of the Ramsar site. The study is valuable because it makes assumptions and spatial relationships discussable. It is not a replacement for management records, current field surveys or official boundary descriptions.
Remote sensing can help distinguish broad land-cover patterns over large areas, especially when comparable imagery is available for multiple dates. But a pixel is not a field plot. Sensors record reflected energy; analysts classify those signals into categories. Cloud cover, image resolution, mixed pixels, seasonal differences and classification choices can affect results. Dense vegetation may be easier to recognize than narrow edges or small patches. Ground observations help check classifications, yet they too represent selected locations and times. A mapped change can therefore reflect real ecological change, differences between image dates, or a combination. Good practice describes the imagery, classification method, accuracy assessment and uncertainty. The public summary of a study may not expose every technical detail; interested readers should consult the paper itself. For a decision affecting one creek, a broad map is a starting point, not a substitute for site-level verification.
The Bhitarkanika-area study uses scenarios to explore alternative futures. Its published results include a modelled decline to around 53 square kilometres of mangrove cover by 2030 under an adverse scenario, and an increase to around 301 square kilometres under a conservation-and-expansion scenario. These numbers are conditional scenario outputs, not predictions that either outcome will occur. The scenarios depend on assumptions about land-use change and interventions; the model does not guarantee that a stated policy will be implemented or succeed. The baseline and scenario areas also belong to the paper’s mapped study area, not to every administrative or protected boundary associated with Bhitarkanika. A reader should preserve the words “under the scenario” when quoting the result. Omitting them would turn a comparative exercise into an unsupported forecast. The value of scenarios is to illuminate possible consequences and trade-offs, then support discussion about what evidence and action are needed.
The same caution applies to modelled carbon. The paper reports a baseline estimate of roughly 4.55 teragrams of carbon across the pools it considered. Its adverse scenario gives a lower stock and associated emissions, while the conservation and expansion scenarios show higher stocks than the baseline. Those results are tied to the article’s methods, definitions, spatial extent and scenario assumptions. They are not a live measurement of the forest’s current carbon and should not be used as though they were an audited carbon credit balance. The difference between a modelled ecosystem stock and a tradable offset is fundamental: the latter would require additional rules, monitoring, accounting and verification. The research can help explain why land-cover change matters for carbon, but it does not itself certify a project, establish ownership or authorize a financial claim. Any numerical communication should identify the source and clearly state that the values are estimates for its study scenarios.
Modelling ecosystem services requires simplification. A model may represent a landscape in cells, assign parameters to land-cover classes and estimate the movement or storage of material. These choices make calculation possible, but the natural system is more varied than the categories. Local measurements may be sparse; published values may be transferred from other sites; the future path of land use is uncertain. Stakeholder input can add important knowledge about pressures and priorities, but it is not identical to a biological survey. The paper’s combination of data and stakeholder perspectives is useful precisely because no single method answers every question. It also means that readers should look at methods and limitations rather than quote an abstract figure without context. Reproducible research explains data sources, model settings and validation. Conservation planning benefits when estimates are tested against new observations and revised as better evidence becomes available.
It is tempting to compare the paper’s 2020 mapped baseline to an older or newer area figure from another source. Such comparisons should begin by checking whether both figures refer to the same boundary, land-cover definition, season, sensor and classification process. The Ramsar site’s 65,000-hectare extent is an administrative wetland area designated in 2002, not a directly comparable mangrove-cover estimate. A forest guide’s species count is not a measurement of area. An official protected-area description may define a national park or sanctuary differently from a research study. When two numbers differ, that alone does not demonstrate error. The difference may reveal that they measure different things. A useful public explanation names the source, the date and the denominator, then states what cannot be inferred. That small discipline prevents false trend claims and gives future monitoring a more reliable baseline.
Conservation Means Keeping the Connections Working
Protecting a mangrove forest is not only a matter of counting trees. Hydrological connectivity influences the delivery of freshwater and sediment, the exchange of tidal water and the connection between forest and adjacent habitats. A barrier or channel alteration may have different consequences depending on its location, design and cumulative effects. This article cannot determine the impact of any particular structure or project; that requires site-specific environmental assessment and verified local evidence. At a general level, the connection principle is clear: management decisions should consider the network of creeks and land-water pathways rather than focus exclusively on a parcel’s canopy. Monitoring can track vegetation, water levels, salinity, sediment and species observations, with methods documented so records are comparable through time. Combining satellite analysis with field checks helps separate broad landscape patterns from on-the-ground conditions.
Conservation measures should also be evaluated against the ecological conditions that make a site suitable. Planting seedlings in an area where tidal flow or salinity is unsuitable may have poor results, even when the species is native to the wider region. Restoration planning therefore benefits from understanding why vegetation was lost, what water and sediment processes operate there, and whether those processes can recover. A single planting total is not a reliable measure of long-term success. Survival, natural recruitment, species composition, hydrological function and persistence over time are among the indicators that may matter. Each project needs a clear baseline and a monitoring period appropriate to its goal. Public reporting should distinguish seedlings planted from trees established, and early establishment from a functioning forest. These are general ecological principles; no specific restoration project or current outcome in Bhitarkanika is asserted here without an identified project source.
Protection also involves people who live and work in coastal landscapes. The peer-reviewed study includes stakeholder input, reminding readers that ecosystem services and land-use decisions affect communities as well as habitats. The existence of consultation in a research project does not show that every local group was represented or that any particular policy was agreed. Community knowledge can help identify seasonal changes, access routes and long-term observations that satellite data may miss. It should be treated respectfully, with consent and appropriate attribution, rather than extracted as decorative testimony. Equally, conservation should not treat residents as an obstacle by default. Decisions about livelihoods, access and land management involve rights and responsibilities that cannot be resolved by a map or a carbon estimate alone. A careful article can acknowledge these social dimensions without making unsupported claims about local consensus, compensation, conflict or outcomes.
Climate change adds another layer of uncertainty for coastal wetlands. Changes in sea level, storms, rainfall and freshwater flow can interact with local land use and sediment dynamics. The direction and magnitude of impacts vary by location, and local adaptation depends on space for ecosystems to shift, as well as the condition of the watershed and coast. The Government of India’s climate policy materials discuss wetlands and climate risks in a national context; the existence of that policy discussion does not provide a site-specific forecast for Bhitarkanika. A proper forecast would need a defined location, timeframe, climate scenario, hydrodynamic assumptions and local validation. The safest conclusion is not that one outcome is certain, but that connected monitoring and adaptive management matter. Researchers can track indicators over time, compare observed changes with scenario assumptions and update management as evidence improves. Uncertainty is a reason to learn systematically, not a reason to present speculation as fact.
Protected status can provide a framework for conservation, but legal labels alone do not reveal current ecological condition. Ramsar designation recognizes an internationally important wetland under the Convention’s system; the site record also provides a dated description of the area. Wildlife Odisha maintains public pages for the Bhitarkanika National Park and sanctuary, which should be consulted for official unit descriptions. Such pages are useful references but should not be assumed to contain up-to-the-minute access instructions or current species totals unless they expressly say so. A designation does not demonstrate that every habitat is intact, nor does it settle every management question. Visitors and researchers should follow current official rules, and any specific permit or access claim requires current confirmation from the relevant authority. This article is not a travel guide and makes no promise about operating hours, entry gates, routes, boat services or visitor facilities.
Questions for the Next Generation of Research
One priority is to maintain comparable maps across time. A useful time series would document image sources, classification methods, accuracy checks and boundary definitions, and would make the underlying uncertainty visible. Researchers could then distinguish changes in extent from differences in method. Field plots and repeat photography in representative environments could ground-truth remote sensing results. Records should sample more than the most accessible sites and account for season. A mapped loss might call for a different response if it reflects a channel shift, conversion, storm impact or classification error. Cause matters because intervention depends on the process. Open methods and clear metadata allow independent teams to check the analysis and add new observations. These are research priorities, not claims that a particular monitoring programme is currently underway. The publicly available literature can guide questions; current status should be verified with the agencies or researchers responsible for each project.
Another priority is linking hydrology and ecology. Repeated measurements of tidal water levels, salinity, sediment movement and freshwater input could be analyzed alongside vegetation and habitat observations. That combination would help explain not only where mangrove cover is present but why it changes. The data need consistent sampling protocols and long enough time series to separate short-term variation from lasting trends. A single high-water or low-water observation cannot characterize an estuary’s annual cycle. Researchers could also compare areas with different channel connections, while avoiding the assumption that one site is a perfect control for another. Changes in storms, catchment land use and local water management may affect sites differently. Careful study design makes those limitations explicit and helps readers assess which conclusions travel beyond the sampled locations.
Carbon research can improve by reporting pools, depth intervals, sampling density and the uncertainty around estimates in a consistent way. Biomass and soil carbon are not interchangeable, and their response to disturbance or restoration may occur over different timescales. If studies use different soil depths or plot designs, the headline totals may not be comparable. A robust monitoring system could pair field inventories with satellite-based mapping and clearly identify what each component contributes. It should also distinguish ecosystem carbon from claims about avoided emissions or offsets. A carbon stock is a quantity at a given time; sequestration is a change through time; an offset is a separate accounting claim that requires additional evidence and safeguards. Researchers and policymakers can use these distinctions to communicate more accurately. The 2022 study provides a modelled basis for scenario comparison, not a substitute for repeated measurements or a certification framework.
Ecological monitoring should be accompanied by social research conducted with appropriate local participation. Residents may hold observations about changes in fishing grounds, channel access or seasonal conditions, but those observations should be collected with consent and interpreted in context. Researchers should explain who participated, how views were gathered and what the data can support. It would be inappropriate to infer unanimous community preferences from a small group or to publish sensitive customary knowledge without authorization. Social and ecological evidence can inform each other: a change in habitat may affect livelihoods, while a change in livelihood practices may influence resource use. But causal claims require evidence and careful analysis. Transparent work helps managers identify where additional consultation is needed and which questions remain open. This is a general research recommendation, not a statement about the views or activities of any named community in Bhitarkanika.
Finally, public communication should make uncertainty understandable without burying readers in technical language. A good summary can tell readers the study area, year, data type, headline estimate and major limitation in one place. It can use a map to show the boundary, a chart to compare scenarios and notes to identify assumptions. If a result is a model scenario, the label should remain attached to it wherever it is quoted. If a species count comes from a dated inventory, the date should travel with the number. If an official page is static or its update date is unclear, that should be stated. Such habits make science more useful to decision-makers and the public. They also protect the value of the original research: a nuanced study should not be reduced to a dramatic but unsupported claim. The distinction between fact, estimate and possibility is not a weakness; it is the foundation of trustworthy explanation.
Sources and Evidence Notes
Ramsar Sites Information Service, “Bhitarkanika Mangroves,” site 1205, designation and information record (2002): https://rsis.ramsar.org/ris/1205. Odisha Forest Department, Mangroves of Odisha: A Pictorial Guide: https://odishaforest.in/admin/data/documents/publication_file_1950704990.pdf. Kadaverugu, A. and colleagues (2022), peer-reviewed spatial ecosystem-services study of the Bhitarkanika mangrove landscape, Journal of Coastal Conservation: https://link.springer.com/article/10.1007/s11852-022-00877-0. Odisha Wildlife, “Bhitarkanika National Park”: https://wildlife.odisha.gov.in/wildlife-unit-details?unitId=68740ffaadf3cfe6dae13fce. National Centre for Sustainable Coastal Management, “Bhitarkanika”: https://ncscm.res.in/bhitarkanika/. Government of India, National Action Plan on Climate Change resources, updated national climate commitment document: https://napccindia.moef.gov.in/resources/pdfs/india-ndc-updated-2022.pdf. Checked 30 October 2026. Ramsar species information is historical; study areas and model scenarios are not current census results or guaranteed forecasts.
This content is a collection of ancient history,books and various articles and collection of library and news and other post ; all details may not be the same. Readers are requested to verify the information themselves. Readers are not allowed to take any disciplinary action; content is only for educational purposes. If readers do not agree about the contents, they may send a personal comment to my personal email ID: achary.purna@gmail.com
