
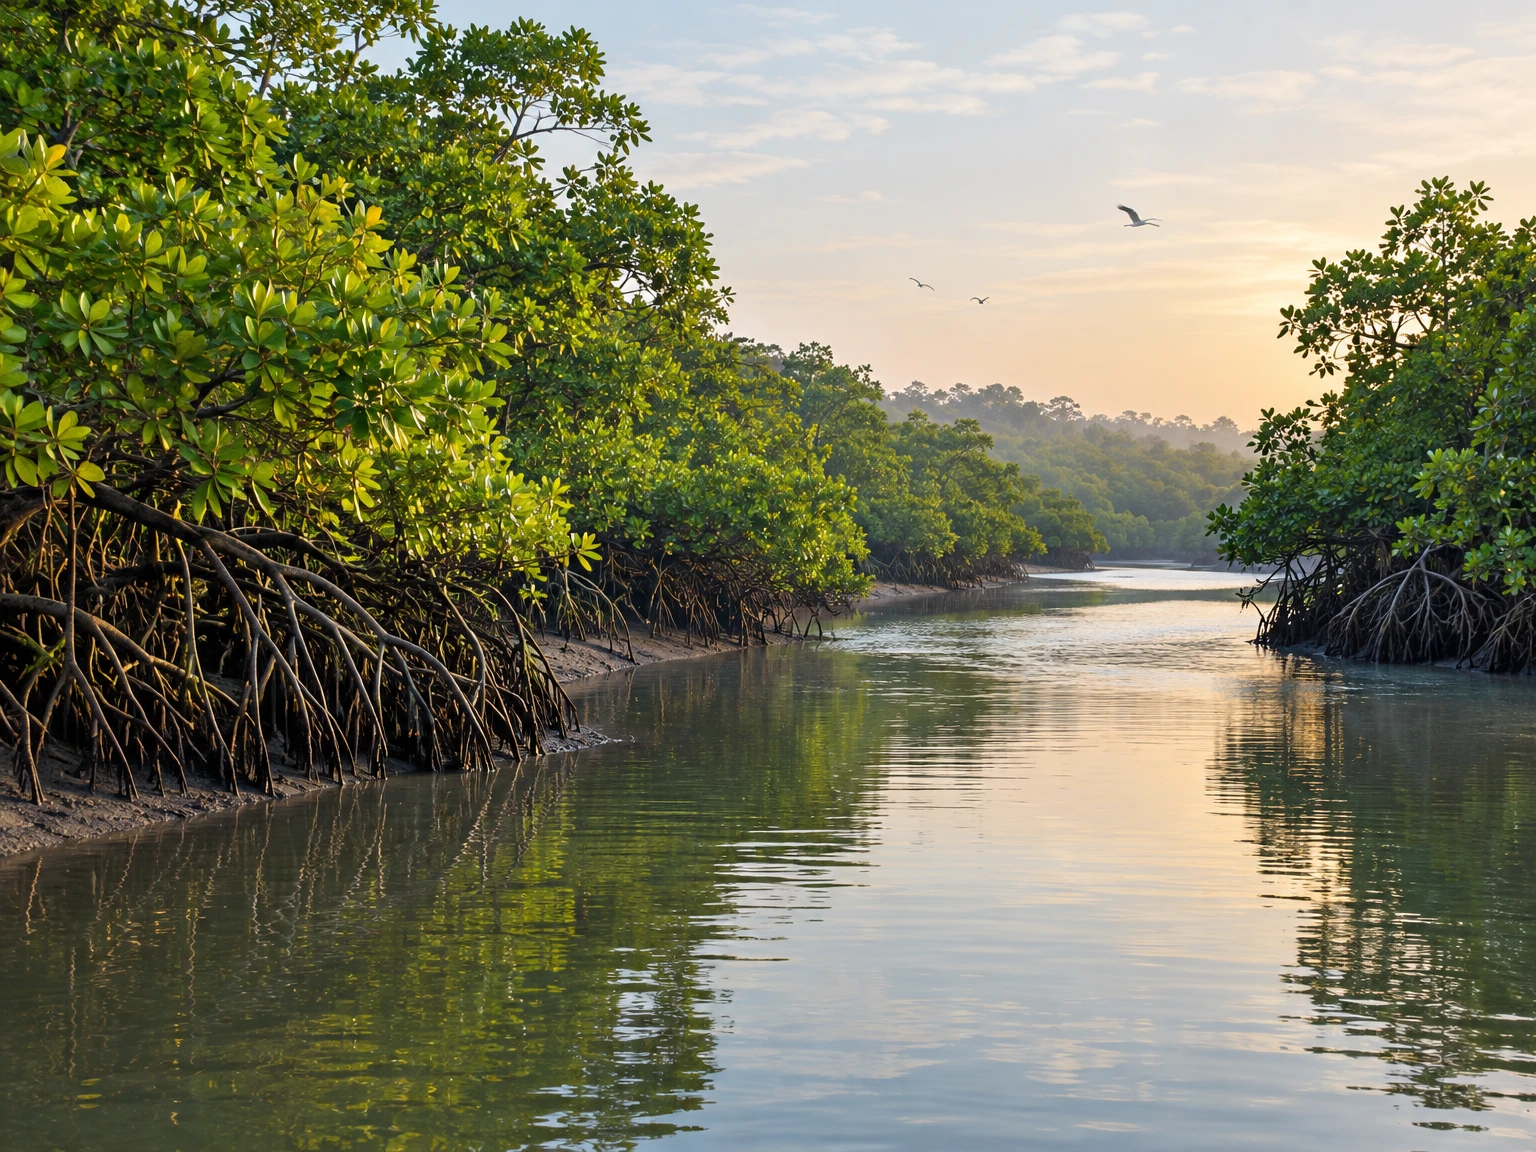
Bhitarkanika is often introduced through its crocodiles, birds, creeks or mangrove canopy. A useful way to understand the forest is to follow a quieter question: where does fresh water meet salt water, and how does that meeting shape the plants that can live in each place? The answer is not a single line on a map. It changes with the tide, rain, river flow, soil and the small elevations of a delta. A creek bank that is flooded twice in a day is not the same habitat as a raised patch behind it, even when both look equally green from a boat. The forest is therefore a living map, written in water levels, sediment and plant communities. Reading that map can explain why Bhitarkanika’s mangroves are diverse, why their condition cannot be reduced to one area figure, and why conservation must pay attention to freshwater as well as the coast.
A delta built by more than the sea
Bhitarkanika lies in Kendrapara district in the deltaic landscape shaped especially by the Brahmani and Baitarani rivers and their distributaries. The Odisha Forest Department describes the mangrove belt between the Dhamra mouth and Barunei, and notes that the rivers’ influence contributes to the richness of the terrain. The estuary is not simply a forest beside the ocean: it is a changing meeting ground where river-borne water and sediment, tides, rainfall and coastal processes interact. Water moves through channels and creeks, spreads over low ground and retreats, leaving fine sediment behind. These processes create a patchwork of shallow channels, mudflats, banks, islands and forest interiors. The patchwork is continually adjusted, so a map made in one season can capture a different pattern of water and vegetation from a map made after the monsoon or a run of dry months.
Names and boundaries matter because “Bhitarkanika” can refer to more than one mapped or legally defined area. The Forest Department’s publication describes a wildlife sanctuary of 672 square kilometres and a National Park core of 145 square kilometres; other publications may use different administrative or ecological boundaries. Those figures should not be treated as interchangeable measures of mangrove canopy. A protected-area boundary can include water, mudflat and other habitats as well as forest, while satellite studies may define their mangrove study area differently. The Forest Department records the sanctuary’s notification in 1975, the core’s declaration as a National Park in September 1998 and Ramsar designation in 2002. The Ramsar designation recognises wetland importance; it does not mean every part of the wetland has the same legal status or condition.
Why the water is never just “fresh” or “salty”
Salinity is a gradient, not a fixed label attached to a creek. Tidal water carries salt inland, while rainfall and river discharge can dilute it. The balance shifts with the season, the strength and timing of freshwater inflows, the opening and shape of channels, and local barriers or embankments. Even within one forest block, water can differ between a river-facing edge, a narrow creek, a shallow depression and a slightly raised interior. The published climate-risk assessment for Bhitarkanika discusses increasing salinity trends at monitoring stations and identifies reduced freshwater flows among the factors that may matter. This is a reason to study catchment flows and local water conditions, not a licence to claim that every creek is becoming saltier at the same rate or that one observation describes the entire forest.
For plants, the important question is not only the salt concentration on a particular day. It is how often roots are submerged, how long water stays, what oxygen is available in the sediment, and how salinity changes through a growing season. Mangrove plants are adapted to intertidal conditions, but species differ in their tolerances and strategies. A location that has suitable flooding and salinity for one species may be less suitable for another. The Odisha Forest Department’s account describes mangrove substrates as waterlogged and often low in oxygen, and explains that mangrove plants have adaptations for such difficult conditions. These are broad ecological patterns; they do not mean every species has the same tolerance, nor that a high-salinity reading alone predicts whether a tree will survive.
Freshwater is therefore part of mangrove conservation, even though the forest grows in a tidal coastal setting. Rainfall and river flows influence the salinity of creeks and soils, while tides bring the seawater that makes an estuary an estuary. Too little freshwater at critical times can shift the balance experienced by plants; too little tidal exchange can also alter the conditions that shape the forest. The 2023 climate-risk assessment recommends monitoring hydrology and water quality across the catchment, including freshwater flows into Bhitarkanika from the Brahmani and Baitarani systems. It also discusses rainwater conservation and water-management measures as possible adaptation approaches. These are recommendations for assessment and planning, not evidence that any one intervention has been implemented everywhere or that a single engineering fix is sufficient.
How plant communities form a landscape
A forest’s species pattern can reveal the conditions beneath its canopy. In mangroves, a river edge may receive a different mixture of tidal water and sediment from an inner patch. Elevation changes how frequently roots are flooded; creek shape affects water movement; and sediment texture influences how long water remains around roots. Those factors can produce local differences in plant communities. A 2014 ecological analysis of four Bhitarkanika forest blocks described semi-diurnal tides and compared sites at different distances from the Maipura River mouth. The study is useful as a snapshot of site-level variation, not a timeless map of every mangrove stand. Its broader lesson is that species distribution should be read alongside physical setting and survey method rather than reduced to a simple sequence of plants from “sea” to “land.”
Odisha’s mangrove flora includes both true mangroves and associated plants that occur in the wider coastal environment. The Forest Department’s publication reports 73 mangrove species and associates in Bhitarkanika, while other studies and assessments give different totals because they classify species and study boundaries differently. These totals are not necessarily contradictions: a count of true mangroves is not the same as a count that includes associates, and a survey from one date or site may not record every plant present. Some prominent mangrove genera reported for the region include Avicennia, Rhizophora, Sonneratia, Excoecaria and Heritiera. The scientific names help avoid confusion with local names that may vary, but the list should not be mistaken for a complete inventory or a claim that each species is abundant throughout the park.
Species composition is more informative than a single headline total. The climate-risk assessment distinguishes true mangroves from associates and describes changing species mixes along rivers and creeks in relation to salinity. It reports that some species are more commonly present near riverbanks in the observed areas, while more salt-tolerant species can become prominent in other patches. This kind of evidence helps frame questions for repeated monitoring: are the same species present at the same sites over time, are seedlings recruiting, and are mature trees being replaced by a different mix? A change in the list of recorded species does not automatically show that a species has vanished from the whole landscape. It may reflect where the survey took place, which season it covered, or how the study defined the vegetation categories.
Plants also affect the habitat around them. Stems, roots and fallen leaves slow water locally, trap some sediment and create surfaces where small organisms can shelter. The effect depends on the plant structure and the flow; mangroves do not act as a uniform wall that stops all waves or flooding. Dense roots can make a creek edge physically complex, while open mud or a water channel supports a different set of ecological processes. Those contrasts are part of the wetland’s value. Conservation should not treat every open patch as a failed forest awaiting planting: mudflats, channels and other habitats can be important in their own right. The goal is to understand the place first, then protect the ecological processes and habitat mosaic that maintain it.
What satellite images can—and cannot—tell us
Remote sensing makes it possible to compare broad patterns over large and difficult-to-reach areas. Researchers can use satellite imagery to classify land cover, estimate canopy density or calculate vegetation indices such as NDVI. A published study using Landsat observations from 1991 to 2021 assessed mangrove extent and vegetation condition in Bhitarkanika National Park. Its abstract reports a decline in mean NDVI from 0.56 in 1991 to 0.43 in 2021 and an increase in the area classified as unhealthy mangroves from 10.91 to 38.26 square kilometres, alongside a decrease in the moderately healthy class. These are the study’s results under its chosen methods and boundaries. They are not a direct count of individual trees, a field diagnosis of every creek, or proof that one cause explains every change.
Satellite measures are valuable because they show spatial patterns, but each has limits. A vegetation index is calculated from reflected light; it does not directly identify the cause of a lower value. Seasonal timing, cloud cover, sensor resolution, water beneath the canopy, mixed land-cover pixels and classification decisions can affect comparisons. A broad “unhealthy” class can flag places for investigation, but field observations are needed to understand whether a patch is affected by salinity, altered flooding, disturbance, disease, canopy gaps or another factor. Similarly, an image may show a change in mapped area without explaining whether the boundary moved naturally, whether a restoration plot matured, or whether a classification rule changed. Strong monitoring combines repeat images with ground checks, transparent methods and local knowledge.
It is also useful to separate “forest cover,” “canopy condition” and “species composition.” A planted or naturally regenerated patch may increase mapped green cover while still having a different species mix or structure from a mature forest. A canopy may remain visible while the underlying seedlings or water flows are changing. An area estimate says how much of a defined class appears on a map; it does not by itself measure biodiversity, resilience or the quality of habitat for every animal. Researchers therefore use multiple indicators: satellite observations, field plots, water and soil measurements, records of seedlings and mature trees, and information about land use. Each answers a different question. When reports disagree, the first thing to compare is often the date, boundary and definition—not to assume that one count must be wrong.
The forest’s scale also requires more than one kind of observation. A field team can carefully identify plants and inspect roots, but it cannot easily visit every creek at every tide. A satellite can repeatedly view a wide area, but it cannot reliably distinguish every species beneath a closed canopy. Local fishers, forest staff and residents may notice changes in access, water movement, unusual dieback or shifting creek edges that a short scientific survey misses. Those observations are valuable leads, though they need dates and locations and should be checked before being treated as general findings. A good monitoring system links these sources: broad remote-sensing signals help choose field sites; field observations clarify what the signal means; and local observations help define questions worth testing.
Pressure on the forest is not one problem
Studies and assessments describe several pressures that may affect mangroves, including changes in freshwater supply, local land-use conversion, fragmentation, pollution and human activity. Their evidence is not all of the same kind. A stakeholder assessment published in 2023 used interviews and participatory methods to document what residents and other respondents considered important drivers of mangrove change in Bhitarkanika and the Mahanadi delta. It recorded perceptions involving population growth, tourism, deforestation, aquaculture and other pressures. Such accounts show what participants experience and prioritise; they should not be presented as a controlled measurement proving that each activity has a particular ecological effect at every site. Research can use the accounts to identify locations and mechanisms for follow-up.
Freshwater change is especially important because it connects the mangrove forest to a much wider catchment. Rivers bring water and sediment from upstream, so conditions in the forest can be influenced by events and decisions beyond the park boundary. The climate-risk assessment considers declining freshwater flow and increasing salinity as linked risks, and notes that species composition may change along creeks. It also points to the need for continued water-quality and hydrological monitoring. This does not mean every upstream intervention has a predictable effect at every creek, or that mangrove health can be explained only by salinity. It means that water availability and timing deserve to be measured together with tidal exchange, sediment and vegetation rather than treated as background details.
Land conversion and fragmentation can alter the shape of a forest as well as its area. When a patch is divided by an embankment, cleared edge or other barrier, water movement and access may change. A small opening could be a natural channel, a working landscape or a disturbance; a map alone cannot decide which. The Forest Department’s publication notes fragmentation and degradation in other parts of Odisha’s mangrove coast, including the Mahanadi delta, and distinguishes Bhitarkanika as a relatively well-preserved stretch. That comparison is useful, but “relatively well-preserved” does not mean free from pressure. It signals that the broader coastline contains different conditions and that each area needs its own evidence and management response.
Pollution is another issue that should be handled precisely. A 2023 stakeholder study discusses concerns about industrial activity and water quality in estuaries and mudflats, while the climate-risk assessment focuses on hydrology, salinity and ecosystem vulnerability. Those publications raise matters for monitoring; they do not replace site-specific measurements of contaminants or establish the concentration in a particular creek today. Responsible writing distinguishes a reported concern from a measured result. A useful field programme would specify sampling locations, dates, substances tested and comparison standards, then publish the method and findings. Without those details, a broad claim about a specific source or effect could unfairly assign blame and mislead readers.
Tourism and livelihoods are part of this landscape too. The forest’s wildlife and waterways draw visitors, while nearby communities rely on coastal and wetland resources. A 2023 participatory assessment records stakeholder concerns and social drivers, underscoring that conservation decisions operate in a lived landscape rather than an empty reserve. This is not a reason to assume that tourism or fishing is uniformly harmful or harmless. The effects depend on practices, location, timing, regulation and local conditions. Planning is stronger when it asks who uses a site, what ecological change is documented, and whether a proposed rule or project distributes costs and benefits fairly. Treating local people only as a pressure to be controlled can erase their knowledge and make conservation less durable.
Restoration begins with the conditions for growth
Planting trees is visible, but restoration is not simply a matter of placing seedlings in a bare area. Mangrove establishment depends on whether the site has suitable tidal flooding, sediment, salinity and water movement for the species selected. If the underlying hydrology is wrong, seedlings can fail even when they are healthy at planting. A 2019 vegetation-mapping study describes natural soil and tidal inundation as important conditions for regeneration and argues for matching species to site conditions. That principle supports careful restoration: diagnose why a patch is open, check whether it is naturally a mudflat or channel, and identify whether water exchange has been changed before deciding to plant. It also helps avoid measuring success only by the number of saplings put in the ground.
The climate-risk assessment reports that Odisha’s Forest Department has undertaken mangrove planting since 2014 and describes increased cover and density in target areas. That is a report of restoration activity and observed change in those target contexts, not a guarantee that planting alone will address every risk. A planting programme should record its location, species, date, survival, natural recruitment and maintenance needs. It should also compare the planted patch with a suitable reference area and track water conditions. If a site is becoming more saline or is cut off from tidal exchange, the management question may involve hydrology as much as seedlings. Where natural regeneration is working, protecting the site from disturbance and keeping water pathways functioning may be more useful than adding more trees.
Restoration can also be an opportunity to learn. Managers can compare a treated site with an untreated site, record water levels and salinity, and document which species regenerate without planting. This is not a substitute for conservation but a way to test whether an approach is helping. The measurements should be simple enough to repeat and clearly linked to a question. For example: did the channel opening restore regular tidal exchange; did seedling survival improve; did the planted species match the conditions; did the area’s vegetation structure change? Reporting both positive and disappointing results is essential. If a project only records the number of seedlings planted, it leaves out whether they survived or whether the site’s ecological function improved.
People and protected areas share a changing wetland
Bhitarkanika’s sanctuary and National Park designations provide a framework for protection, but a protected boundary does not freeze water, sediment or human needs in place. The Forest Department dates the sanctuary notification to 1975 and the National Park declaration to 1998; the Ramsar designation followed in 2002. These milestones recognise the area’s conservation importance across different systems. They do not mean every activity in the wider catchment is governed by the same rule, nor that a single designation solves issues such as freshwater access, local livelihoods or pollution. Good communication should state which boundary or law is being discussed, because the sanctuary, National Park, marine area and Ramsar site are related but not identical concepts.
Community participation can improve both the quality and the legitimacy of environmental information. Fishers and residents may know which channels are changing, when water becomes difficult to access, or where unusual vegetation loss has appeared. Scientists and forest staff can contribute species identification, field sampling and long-term comparison. Combining these perspectives does not mean every account is automatically a verified ecological conclusion. It means observations can be documented carefully and then checked. A shared monitoring record might include the date, location, tide or season, observation, observer role and follow-up method. That makes local information more useful for research and management, and it allows disagreements to be explored rather than concealed.
Conservation choices can also affect households unevenly. If access changes or seasonal restrictions are proposed, decision-makers should understand which people depend on the affected location and what alternatives exist. Participatory research in Odisha’s mangrove landscapes makes clear that land use and livelihoods are part of the discussion. But a stakeholder survey is a record of views at a particular time, not a substitute for consultation on a new proposal. Fair planning should provide clear reasons, accessible information and a way for affected groups to respond. It should also avoid promising that one intervention will automatically improve livelihoods or ecological condition. Those outcomes need to be measured, with the people affected included in deciding what success means.
What to watch next
The most useful future picture of Bhitarkanika will not be a single annual headline number. It will connect repeated observations: freshwater inflow and tidal exchange; salinity at comparable stations and seasons; forest cover and canopy condition; species composition and seedling recruitment; and changes at specific creek edges or restoration sites. Each series needs a clear method and a consistent boundary so that results can be compared. Satellite data can identify where a broad signal has changed. Field surveys can explain what plants and soils are there. Water measurements can test whether a proposed hydrological explanation fits. Community observations can direct attention to places that a survey may have missed. Together, they can reveal whether a change is local, seasonal or part of a longer pattern.
Readers can help by being careful with claims. A reported trend should include the years and measurement used. A species total should say whether associates were included. A forest-area number should identify the map boundary. A prediction should be labelled as a scenario or model, not as a result already observed. If a report identifies an increase in salinity at monitoring stations, do not automatically translate that into “all mangroves are dying”; if an area has gained tree cover, do not assume every ecological function has recovered. The distinctions are not technical fussiness. They keep public discussion honest and help conservation teams focus on what can be measured and acted on.
Bhitarkanika is resilient because its mangroves are adapted to a dynamic environment, but resilience is not the same as invulnerability. The forest depends on the flows, sediments and tidal rhythms that create suitable places for different plants. Its future is tied to decisions and conditions that extend from individual creeks to the wider river catchment. The most careful conservation work respects the natural variety of the wetland, protects the processes that sustain it, and tests interventions against evidence. Seeing the mangrove landscape as a living map—rather than a uniform green block—offers a practical starting point. It invites us to notice where freshwater arrives, where the tide reaches, how the forest changes, and which questions must be answered before a claim or a solution is treated as certain.
Sources and further reading
- Odisha Forest Department, Mangroves of Odisha — overview of the coastal mangrove belt, Bhitarkanika designations and reported flora.
- An Ecological Analysis of Mangroves Ecosystem of Odisha on the Eastern Coast of India — field observations from four Bhitarkanika forest blocks.
- Climate Risk Assessment of Bhitarkanika Mangroves, Odisha — assessment of salinity, freshwater flow, species change and adaptation options; recommendations and views are those of its authors.
- Vegetation Mapping and Management Strategy of Mangroves of Bhitarkanika Wildlife Sanctuary, Odisha — remote-sensing and field-based management study.
- Participatory stakeholder assessment for drivers of mangrove loss in Bhitarkanika and Mahanadi delta — records stakeholder perspectives using participatory methods.
- Ramsar Sites Information Service: Bhitarkanika Mangroves — site information and wetland designation.
This content is a collection of ancient history,books and various articles and collection of library and news and other post ; all details may not be the same. Readers are requested to verify the information themselves. Readers are not allowed to take any disciplinary action; content is only for educational purposes. If readers do not agree about the contents, they may send a personal comment to my personal email ID: achary.purna@gmail.com
