
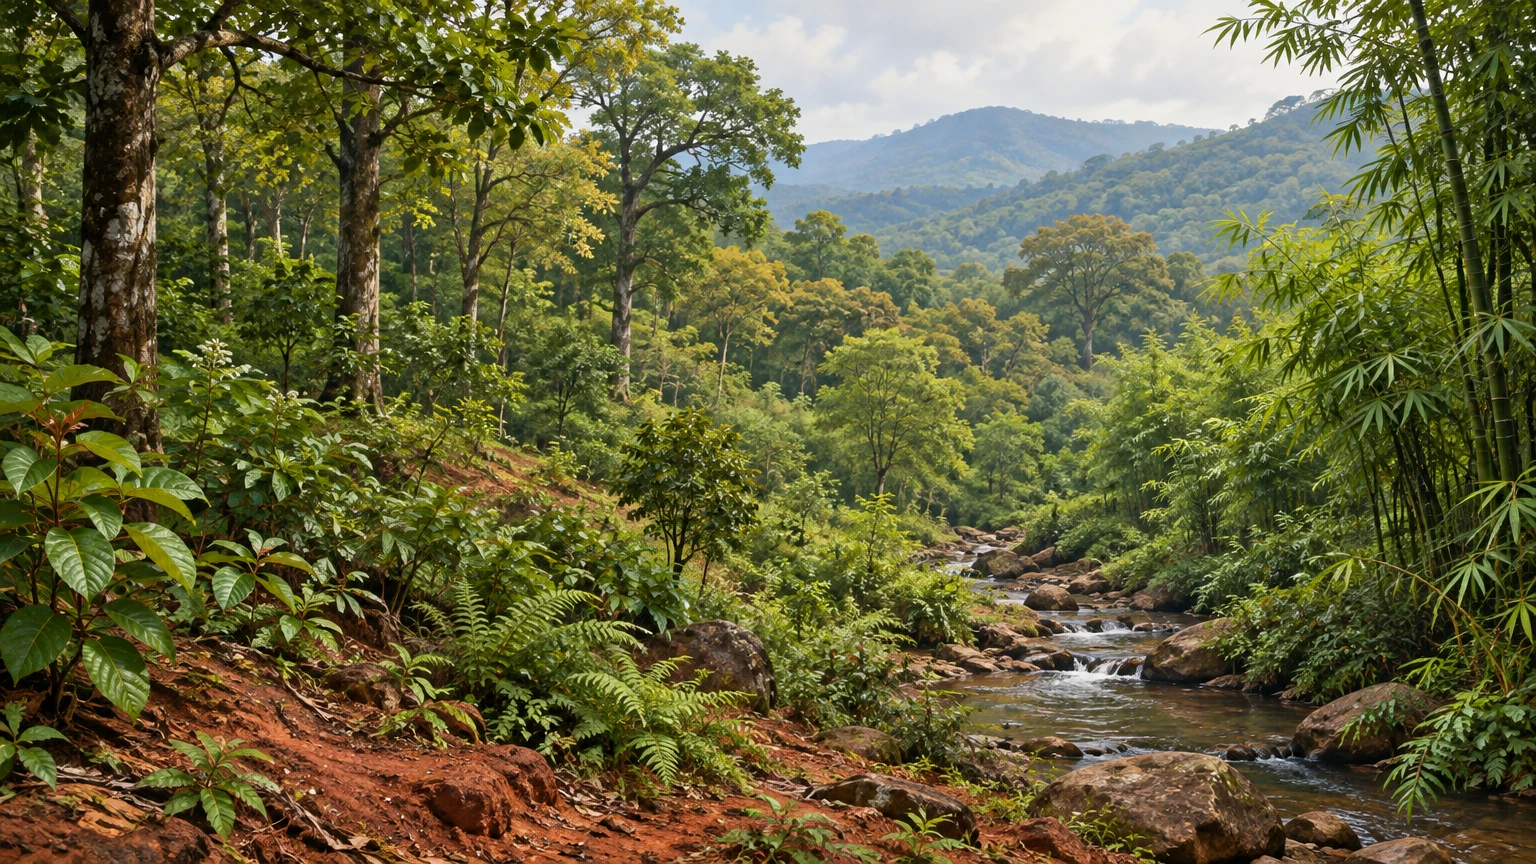
How geography, forest structure, plant inventories and careful measurement reveal a changing landscape

Why a plant diversity story begins with geography
Odisha’s plant life is not one uniform green cover. It is a meeting place of mountains, plateaus, river basins, coastal plains, wetlands and the Bay of Bengal. A plant community on a hill slope in the Eastern Ghats experiences different soils, drainage, exposure and local climate from vegetation beside a river delta or a tidal creek. These contrasts shape which species can establish, when they flower or shed leaves, and how plants interact with fungi, insects, birds and people. The Odisha Biodiversity Board (OBB) describes four broad physiographic regions: the Northern Plateau, Eastern Ghats, Central Tableland and Coastal Plains. It also points to forests, wetlands, grasslands and agrarian landscapes as parts of the state’s natural mosaic [1].
That map is a useful starting frame, not a botanical inventory. A physiographic region can include many habitats, and a district boundary does not mark a biological boundary. A river valley may connect habitats across districts; a hill range may hold differences over short distances in slope and elevation. To understand plant diversity, we must therefore move between scales: the state-wide picture, a particular habitat, a measured plot, and the individual plant. Each scale answers a different question. State figures describe broad patterns, while field inventories tell us which plants were recorded at a particular place and under a particular method.
Odisha’s position on India’s east coast and its range of landforms create a landscape in which rainfall, temperature, soil and water availability vary. The OBB webpage gives broad statewide rainfall and temperature ranges, but such ranges should not be mistaken for the weather of every locality or month [1]. A plant responds to conditions where it grows. A broad statewide average can hide a dry ridge, a damp ravine, a saline estuary edge and a shaded forest floor. The central question is not simply “How many plants does Odisha have?” It is also “Where were they recorded, what conditions support them, and what evidence would show that those conditions are changing?”
What people mean by “forest”
Two different ideas often appear in discussions of Odisha’s forests: land recorded or administered as forest, and forest cover mapped from tree canopy. They are related but not interchangeable. The Forest and Environment Department’s 2019–20 annual activity report gives Odisha’s recorded forest area as 61,204.17 square kilometres, or about 39.30 percent of the state’s geographical area. That is an administrative area figure assembled from recorded classes of land [2]. In the same report, the Forest Survey of India’s 2019 assessment is reported as 51,619 square kilometres of forest cover, about 33.15 percent of the state’s geographical area [2]. The difference is not, by itself, evidence of a sudden loss between two measurements: the two figures describe different concepts.
For its forest-cover mapping, the Forest Survey of India defines forest cover as land of at least one hectare with tree canopy density of at least 10 percent, regardless of ownership or legal status; the definition also includes orchards, bamboo and palms [3]. A tree-covered private plot can therefore count as forest cover under this mapping definition without being a legally recorded forest. Conversely, land recorded as forest may have sparse canopy, be temporarily open, or contain a mosaic that does not meet the canopy threshold. The measured canopy class is not a complete description of species composition, ecosystem quality, legal protection or the condition of every patch.
Canopy thresholds are useful because they make large-area satellite mapping comparable, but they simplify a living landscape. A hectare with a closed, diverse native canopy and a hectare with a simpler tree cover could both enter the forest-cover total, even though their ecological characteristics differ. A small but species-rich patch under one hectare might not appear as a separate mapped forest-cover unit at all. Remote sensing is powerful for repeated broad assessment; field methods are needed to distinguish plants, regeneration, understory, dead wood, invasive species and ecological relationships. Good reporting keeps these evidence types separate instead of asking one headline percentage to answer every question.
The OBB’s biodiversity webpage describes about 37 percent of Odisha’s geographical area as forested and gives broad plant and fungi totals [1]. Those statements should be cited as the board’s webpage figures, whose underlying reference year and detailed counting protocol are not stated in the text available here. They should not silently replace the dated 2019 forest-cover assessment or the separate recorded-area figure. When numbers look inconsistent, the first task is to check their definitions, dates, boundaries and methods. A reader should not average them, choose the largest, or call any one of them the current truth without a current comparable source.
From a canopy to a forest community
A forest is more than its tallest trees. Its vertical structure can include emergent crowns, a main canopy, smaller trees, shrubs, herbs, climbers, epiphytes and plants growing along streams or clearings. Below ground, roots compete and cooperate for space and resources; fungi can connect with roots, while decomposers return nutrients from fallen leaves and wood. Above ground, flowers, fruits and seeds create seasonal resources for pollinators, dispersers and other animals. Not every forest has all these layers in the same form, and their proportions vary with species, age, terrain, disturbance and rainfall.
Botanists use the word “community” for the organisms found together in a place, but that does not mean every species has the same needs or role. Some plants tolerate shade and establish beneath existing trees. Others need strong light and grow at gaps or edges. A climber may use a tree as a support without being a parasite; an epiphyte grows on another plant while obtaining water and nutrients from the surrounding environment. Herbs may be visible only during a particular season. A single visit can miss dormant, flowering or short-lived plants. Reliable plant records therefore depend on repeat visits and attention to season, not merely a long species list.
Forest structure changes through time. Young regrowth after disturbance may have many fast-growing light-demanding plants, while older patches can develop a different balance of canopy and understory species. Natural gaps created by fallen branches or trees are part of forest dynamics; not every opening proves degradation. At the same time, repeated clearing, fire, grazing, extraction or infrastructure may alter regeneration and fragment habitat. Identifying the cause requires local evidence. A photograph of an open patch cannot, on its own, establish when or why it opened, whether it is recovering, or what management should follow.
Plant diversity is also not captured by species richness alone. Richness is the number of species found in a defined survey. Evenness describes how individuals are distributed among those species. A plot with many species but a few overwhelmingly dominant plants may differ from a plot where abundance is more evenly shared. Functional traits, such as leaf form, rooting depth or flowering time, can help explain ecological processes, but they need measured evidence. Every diversity claim should say what was sampled and what “diversity” means in that context.
Broad forest types and what their names tell us
The OBB webpage identifies northern tropical semi-evergreen forest, tropical moist deciduous forest, tropical dry deciduous forest and tidal mangrove forest among Odisha’s major forest types [1]. These labels describe broad ecological patterns rather than a promise that every site fits neatly in one category. A semi-evergreen forest retains more foliage through parts of the year than a strongly seasonal deciduous forest, but individual species may still shed leaves. Moist deciduous forests experience a marked dry season while receiving conditions that support a different composition from drier deciduous areas. Mangrove forests are shaped by tides, salinity, sediment and freshwater flows, not just by rainfall on land.
Forest-type names can help a reader imagine the broad structure, but they should not be used as substitutes for a local survey. Forest types grade into one another. Elevation, slope direction, soil depth, water movement and past use can produce variation within the same mapped class. An ecologist may use plot data and environmental observations to distinguish this variation. A district-wide label is a guide to a landscape, not proof that a particular species occurs at every location in the district.
Seasonality is particularly important in deciduous forests. As water availability declines, many trees shed leaves, reducing water loss through foliage. Other species retain some leaves, flower, or fruit at different points in the annual cycle. A dry-season photograph and a monsoon photograph of the same stand can look like different places. This change does not mean the forest has vanished during the dry months. The timing and degree of leaf fall differ by species and local conditions; rainfall records and repeat observations are more useful than an assumption that every tree follows one calendar.
On the coast, plant communities respond to conditions that change with the tides. Mangrove plants have adaptations that help them cope with waterlogged, saline or unstable sediments; different species occupy different positions across local gradients. Their roots can help stabilize sediments and create habitat structure, while the broader coastal system includes creeks, mudflats, adjacent waters and other vegetation. Mangroves are not interchangeable with every coastal tree plantation, and a count of planted saplings is not a measure of mature habitat quality. Survival, species mix, hydrology and natural regeneration all matter when interpreting restoration.
Sal: an important tree, not a shortcut for the whole forest
Sal, Shorea robusta, is an important tree in parts of eastern India and is repeatedly associated with Odisha’s forest landscape. The OBB includes Sal among its important aromatic plants [1], while the state department’s forest code lists Sal among its first-class tree species in an administrative classification [4]. Those two references serve different purposes: one is a biodiversity webpage’s broad species listing, the other a forestry code’s management category. Neither statement means that every forest in Odisha is a Sal forest, or that one species can stand for the full diversity of a site.
In a Sal-dominated stand, other plants still matter: associated trees, shrubs, herbs, climbers, fungi and soil organisms contribute to how the ecosystem functions. Which companions occur depends on the site. A species list from one district or sanctuary cannot automatically be applied statewide. Common names can also vary from one language or region to another, so scientific names are useful when a claim needs to be precise. Even the scientific name should be checked against a reliable source where taxonomy has changed or a plant has been misidentified.
Sal’s prominence in local livelihoods and forest use should be handled with care. The state’s official materials discuss forest-based livelihoods and non-timber forest products, but individual collection practices, rights and rules depend on place and community context. A statewide article cannot tell a reader what they may collect from a particular forest, nor should it invite removal of plants from protected or sensitive sites. Respecting local knowledge includes recognizing that communities are not merely observers: they hold knowledge and rights, and conservation decisions should include the people who live with the forest.
A 2023 paper by Paraseth, Paul and Banerjee modelled future habitat suitability of Shorea robusta in Koraput district using MaxEnt. The authors considered climatic years 2050, 2070 and 2080 under two Representative Concentration Pathways and identified slope, minimum temperature of the coldest month and precipitation of the coldest quarter as influential model variables [5]. The abstract reports projected increases in modeled unsuitable area by 2100 and a decrease in high-suitability area under both scenarios. This is a model for one species and one district under stated assumptions, not a measurement of present forest loss or a guaranteed forecast for every Odisha forest. Its value is in making testable questions about species and climate; its limitations are equally important.
Mangroves and the coastal plant mosaic
Odisha’s tidal mangrove forests make visible how strongly plants can be shaped by water and soil conditions. Unlike a terrestrial grove on a slope, a mangrove site is connected to tides and moving sediments. Salinity and inundation vary across small distances, and freshwater inputs may influence the system. The OBB webpage lists 63 species of mangroves and their associates within its broader plant-and-fungi account [1]. Because the page does not state the inventory’s reference year or the detailed definition of “associate,” that number should be presented as the Board’s published count, not as a newly verified current census.
The Forest Department’s 2020–21 report documents mangrove planting in coastal districts and activities in the Mahanadi delta and Bhitarkanika area [6]. That report is valuable evidence of a particular year’s programme; it does not establish the present condition of every planting site. Planting is one intervention, not an automatic synonym for successful restoration. A plantation may fail if tidal flow is unsuitable or the wrong location was chosen. Conversely, a naturally regenerating area may be ecologically valuable without a recent planting programme. For restoration outcomes, the relevant questions include survival over time, species suitability, hydrology, sediment conditions, natural recruitment and the local use of the coast.
Coastal plants can help reduce exposure to some wave and wind impacts when they form part of a healthy system, but no single row of vegetation makes a community immune to a cyclone or storm surge. Risk also depends on topography, tide, storm intensity, shoreline shape, land use and built protection. It is responsible to describe vegetation as one part of coastal resilience, not to promise a safety barrier. This distinction matters because an overconfident claim can lead people to underestimate danger or to treat ecological restoration as a substitute for disaster planning.
Plant communities on a coast include more than mangroves. Dunes, grasses, shrubs, seaweeds, seagrasses and estuarine vegetation have different forms and relationships with the landscape. Some protect inland areas by stabilizing sand or slowing water; others provide food and habitat or contribute to sediment dynamics. A statewide biodiversity source identifies several of these coastal components together [1]. Site-specific claims about where a species is found need location-based records; a general list of coastal plants does not locate each one on a map.
What state-wide plant totals can—and cannot—say
The OBB webpage says the state is home to over 5,174 species of plants and fungi, including 2,800 higher plants, 153 orchid species, 178 pteridophytes, 22 gymnosperms and many other groups [1]. It also lists 300 grasses, 63 mangrove species and associates, 24 seaweeds, seven seagrasses, 17 carnivorous plants, about 300 bryophytes and 275 lichens. These are striking figures, but a reader should notice that the page combines plants and fungi in its opening total and then lists taxonomic and ecological groups separately. These categories do not necessarily form a simple addition table: a group may be nested within another, and the underlying counts may come from different taxonomic treatments or survey dates.
The page further reports more than 1,000 species of freshwater, marine and brackish-water algae, 30 wild edible mushroom species, more than 450 macro-fungi, 300 wild relatives of crop plants and 500 medicinal plants [1]. A species can have several uses or ecological roles; it should not be double-counted as though each use were a separate species. “Medicinal plant” is a use category, not a botanical branch. It may include species also counted among trees, herbs, orchids or other groups. The Board’s published figures are a valuable sign of the breadth of recorded diversity, but their context and method should accompany them whenever they are reused.
Why might counts change? Field teams discover plants not previously recorded in a locality; taxonomists revise species boundaries; synonyms are consolidated; survey areas expand; or a previous identification is corrected. A new record for a state does not necessarily mean the species evolved there recently. It means the documented record has changed. Likewise, a species absent from a particular survey list may have been missed because it was out of season, rare, difficult to identify or outside the sampled habitat. Absence from a list is not proof of absence from the whole state.
Counts also depend on what was included. Does the inventory count only vascular plants? Does it include algae, fungi, lichen partners, planted species or cultivated varieties? Is the unit a species, subspecies, variety or accepted name? Were records checked against vouchers, photographs, herbarium specimens or expert review? Are introduced and cultivated species separated from native flora? These questions do not invalidate an inventory; they help a reader understand what it measures. A sound article states the source’s own scope and avoids presenting a webpage number as though every methodological detail were known.
Local inventories reveal why one state average is not enough
OBB’s research-project page provides examples of sanctuary-level inventories. Its account for Lakhari Valley Wildlife Sanctuary in Gajapati reports 714 plant species in 118 families and 326 genera, including angiosperms, pteridophytes, gymnosperms, bryophytes, fungi and lichens. It further breaks down the recorded forms into climbers, herbs, shrubs and trees [7]. For Karlapat Wildlife Sanctuary in Kalahandi, the page reports 912 plant species under 157 families and 597 genera, and describes multiple plant and fungi groups [7]. These figures demonstrate how much information a place-based survey can provide beyond a single state percentage.
They should not be treated as a league table saying Karlapat is “more biodiverse” than Lakhari. We would first need comparable dates, survey effort, area, methods, taxonomic coverage and definitions. One inventory may have covered more habitats or visited in more seasons. Some groups might have been studied more intensively. A higher total could reflect broader sampling rather than a deeper ecological richness per unit area. A fair comparison needs standardized effort or a careful adjustment for differences, plus a clear statement of what is being compared.
The same page records findings from other protected areas, including an inventory for Kapilash Wildlife Sanctuary in Dhenkanal, with hundreds of angiosperms alongside ferns, gymnosperms, bryophytes, fungi and lichens [7]. It also describes a sand-dune biodiversity study whose interim results included plant and animal counts over a one-year study. The page makes clear that some projects are completed, some are ongoing and others have only preliminary results [7]. That status matters: a provisional finding must not be silently converted into a final inventory.
Protected-area studies are a useful window into local variation, but they do not cover every forest, community landscape, river edge or agricultural mosaic. A sanctuary’s boundary is an administrative unit for protection and management, while ecological processes often cross the boundary. A population of a plant can occur inside and outside; seed dispersal, water flow, fire and wildlife movements can link the landscape. Site-specific research should therefore be read as a detailed sample of a place, not a complete atlas of all Odisha plants.
Endemic and threatened: words that need careful use
The OBB webpage reports 24 plant species endemic to Odisha and notes that 117 plant species, including 41 medicinal plants, are considered threatened [1]. It names Saraca asoca and Symplocos racemosa among species it describes as critically endangered in the state, and lists several others as becoming endangered [1]. These are consequential statements. The page excerpt does not provide a date, assessment criteria, geographic authority or the conservation-status reference behind each label. An article can accurately attribute the statements to OBB, but should not imply that this page alone supplies a fresh, comprehensive legal or global status assessment.
“Endemic” means restricted to a defined geographic area, but the relevant area must be stated. A species can be endemic to Odisha without being endemic to India; a plant endemic to an island or hill range is a different, narrower claim. Endemism is not the same as rarity, and rarity is not identical to threat. Some widespread species can face serious decline; some localized species may be abundant where they occur but still vulnerable to habitat change. A conservation label is meaningful only alongside the authority and assessment date that define it.
“Threatened” is also not a casual synonym for “uncommon.” Formal assessments consider evidence such as range, population trend, fragmentation and extinction risk under a specified framework. The category can change when new evidence or a new assessment becomes available. The same common-name or scientific-name confusion that affects ordinary records can have serious consequences for a threatened-species claim. Good reporting checks the latest source and uses the exact status category and jurisdiction. Where a source only says “considered threatened” without explaining the assessment, that qualification should remain visible.
Publishing locations of vulnerable plants can create risks if the detail facilitates collection or disturbance. Conservation communication should balance public understanding with species protection. A broad habitat description may be useful where precise coordinates are not appropriate. Field observations should follow permit rules and local guidance; rare plants should not be uprooted to produce a photograph. Sharing knowledge responsibly includes respecting the people, places and organisms that make that knowledge possible.
Field methods turn impressions into evidence
A good plant survey begins with a clearly defined question. Are researchers estimating the number of tree species in a forest plot, documenting all flowering plants in a sanctuary, tracking regeneration after restoration, or finding a rare species? Those are different questions and need different designs. A plot-based survey might select plots across slope, elevation or disturbance classes, while a targeted search may focus on a known habitat. The sampling frame should be described so that readers know which locations and conditions were included.
Field records commonly include a date, location, habitat notes, observer, identification confidence and supporting evidence such as photographs or specimens, where collection is authorized. A photograph can support identification when it shows diagnostic features and context, but it may not capture characters needed to distinguish similar species. A specimen can provide durable evidence for later expert review, but collecting requires appropriate permission and care. For rare, protected or culturally important plants, researchers need to follow applicable permits and ethical practice rather than assume that scientific interest overrides local rules.
Survey timing matters because plants can be visible, flowering or fruiting at different times of year. Repeated visits may reveal species missed during an earlier season. Weather, recent fire, grazing, flooding or a disturbance event can change what is observable. If one survey is conducted at one point in time, the report should describe it as a snapshot. It should not imply that the snapshot gives a permanent complete list for the entire habitat.
Identification should preserve uncertainty. If an observer can confidently identify a genus but not a species, a genus-level record is more honest than a guess. If a name has changed, a synonym may be retained alongside the current accepted name so that past and present records can be matched. Local names can be recorded with the language and community context, rather than collapsed into a single statewide label. Such details make records more useful to later researchers and reduce the danger of treating a mistaken name as a conservation fact.
Data quality also depends on transparent classification. A report should distinguish native, naturalized, cultivated and invasive plants where that distinction is relevant and supported. It should explain how abundance was estimated, how plots were selected, and how duplicate records were handled. For large inventories, specimens and data may be deposited with a herbarium or accessible repository, subject to law and ethical limits. These practices do not guarantee that every identification is correct, but they make evidence inspectable and help errors be corrected.
What changes a forest and what evidence can show it?
Plant communities can change through both natural processes and human pressures. Rainfall variability, drought, floods, storms, insects, disease and fire influence growth and survival. Land conversion, roads, mining, repeated fire, harvesting and fragmentation can alter habitat structure or reduce connectivity. No one statewide explanation fits every district or forest. Identifying a driver requires dated observations and a well-defined comparison: which area, which time period, which plant group, and which measure changed?
Satellite imagery can show changes in mapped canopy over time, but canopy change does not identify the cause by itself. A field visit can clarify species composition, regeneration and disturbance signs, but one visit cannot reconstruct a long history. A climate trend can reveal a shift in conditions, but it does not alone prove which species will disappear. A model can test plausible future scenarios, but the result depends on its inputs, assumptions and resolution. Strong assessment combines remote sensing, field work, local knowledge and clearly reported methods rather than treating one source as the whole story.
The Koraput Sal paper is an example of a model-based question: how may habitat suitability for one tree vary under specified future climate scenarios [5]? Its projected suitability changes are not the same as measured disappearance of trees; the model estimates habitat suitability from selected environmental predictors. Monitoring can test whether observations align with those projections, while new data can improve the model. Readers should retain the study’s geography, species and scenario boundaries whenever discussing it. If the research is generalized to all Odisha, it becomes more confident than the evidence allows.
Restoration claims also need measurable outcomes. The number of seedlings planted is an activity indicator, not a survival rate. Seedling survival after several seasons, natural recruitment, canopy development, species composition and ecological connectivity are different indicators. A project may be valuable even when outcomes take years to become clear, but the reporting should separate planned work, completed planting and verified ecological change. A nursery tally cannot establish that a forest has been restored.
Forest plants and people
Plants are woven into daily life through food, materials, medicine, fuel, shade, ritual, crafts and income. OBB notes that non-timber forest products include leaves, tubers, seeds, fruits, mushrooms and medicinal plants, and describes their importance to many rural households [1]. That broad statement is not a substitute for local livelihood research. Which products are gathered, by whom, under what seasonal rules, and how benefits are distributed can differ across communities. It is important to describe those relationships without reducing forest-dependent people to a statistic or assuming that all communities use the same species in the same way.
Traditional knowledge can guide questions about flowering, fruiting, edible plants and local habitat change. It is knowledge held by people and communities, not simply material for an outside writer to extract. Good research should be respectful, accurately attributed where permission allows, and attentive to consent, benefit sharing and community control of sensitive information. A public article should not identify a sacred, vulnerable or commercially valuable plant location in a way that could invite harm.
There can be difficult trade-offs. A restriction intended to protect a habitat may affect people’s access to resources; a livelihood programme may help households while also creating new market pressure on a plant species. These questions need local voices and evidence. A general article can explain the importance of inclusive conservation, but it cannot settle a dispute about rights, access or management in a particular village. Such cases require current law, local rules and the perspectives of the affected people.
Community participation is also a source of durable observation. People living near forests may notice changes in flowering dates, water availability, wildlife or the appearance of a plant over many years. Those observations can complement formal surveys. They should not be treated as anecdote to dismiss, nor as a replacement for careful documentation. Research partnerships can bring together local knowledge and scientific methods, with clear agreements about how information is recorded, stored and used.
How to read a botanical headline
When a story announces a “new” plant or a record number of species, ask: new to whom and where? It may be newly described to science, newly recorded for Odisha, newly recorded for one district, or simply newly reported in a publication. Those meanings are not interchangeable. The first description of a species does not tell us it evolved at that time. A new state record may represent a plant that had been present for generations but was not previously documented. An updated count can reflect better research rather than a sudden ecological change.
When a story reports a decline, ask what was counted and compared. Was it canopy cover, number of individual plants, area of suitable habitat, number of occupied sites or the abundance within fixed plots? Was the method consistent across years? Were seasonal differences accounted for? A reported percentage decline without a baseline, time period or measure is difficult to interpret. A credible article should provide those details or say clearly which ones the source does not provide.
When a story calls a place “pristine,” “untouched” or “the richest,” look for a defined comparison and evidence. Such adjectives can erase the role of residents and long histories of human management, or overstate what a limited survey has established. It is usually more informative to describe the actual features documented: habitat types, survey effort, species groups, conservation status and known uncertainties.
Finally, check the date. A report published in one year may rely on surveys from earlier years. A web page can remain online after a statistic is superseded. A forest-cover assessment is a dated measurement, not a permanent state. For this article, the official forest-cover figure is explicitly tied to FSI’s 2019 assessment, the recorded-area number to the Forest Department’s 2019–20 annual report, and the biodiversity counts to the OBB webpage as accessed on 31 October 2026, whose excerpt does not state a reference year [1][2]. These dates and limits belong alongside the figures, not in fine print after a confident headline.
A practical framework for future Odisha plant reporting
Future articles can make botanical reporting more useful by keeping a small set of habits. First, define the scope: state, district, sanctuary, habitat or plot. Second, identify the source and date of each count or claim. Third, distinguish legal forest records from mapped tree cover and distinguish either from ecological condition. Fourth, preserve taxonomic uncertainty and accepted names. Fifth, distinguish a completed survey from ongoing work and planned restoration from verified outcomes. Sixth, explain what a model predicts and what it does not. Seventh, consider whether publication of a precise location could harm a vulnerable species or community.
For readers, a source list is a starting point for checking claims rather than decoration. A government report may supply official administrative definitions and dated programme information. A biodiversity board webpage may provide broad species totals and project inventories. A peer-reviewed study may answer a narrower research question with explicit methods and assumptions. Each source has a different role. It is better to use a source only for what it supports than to cite an authoritative institution for a claim that appears nowhere in its publication.
For educators, Odisha’s plant mosaic offers a way to connect geography, ecology, measurement and citizenship. Students can compare a map with a field photograph, trace why canopy cover is not the same as species richness, or examine how an inventory changes when sampling covers more seasons. They can learn to separate observation from inference: “I saw leaves falling in this dry-season image” is an observation; “the forest is dying” is an inference that requires more evidence. These distinctions are fundamental scientific habits, not merely editorial caution.
For conservation planners, a single number cannot decide priorities. Species risk, habitat connectivity, local livelihoods, water flows, land rights and management capacity all matter. Information should be updated and compared like with like. Monitoring can reveal whether a conservation action is working, but results should be interpreted in the context of climate, disturbance and local conditions. The goal is not to produce the most dramatic figure; it is to make decisions with evidence that is relevant, transparent and fair.
Conclusion: diversity is a pattern, not just a count
Odisha’s plant diversity emerges from differences in landform, water, season, soils and human relationships with the landscape. Its forests include broad deciduous and semi-evergreen types as well as coastal mangrove systems, while local inventories reveal rich and varied plant communities across protected areas. Statewide totals are useful signposts, but they need dates, definitions and methods. Forest cover, recorded forest area, species richness and habitat quality are related measures that answer distinct questions.
Careful botanical writing can hold wonder and uncertainty together. The presence of Sal, orchids, mangroves, medicinal plants, fungi and many other groups invites curiosity, while inventories and models remind us that knowledge is always tied to a place, a method and a date. The most responsible account does not pretend that one headline statistic captures a changing state. It shows what is known, how it was learned, what remains uncertain and why those differences matter for plants and for the people who share their landscapes.
Sources and provenance
- Odisha Biodiversity Board, “Biodiversity of Odisha” webpage; counts, broad physiography and ecosystem descriptions cited as published by OBB, accessed 31 October 2026. The webpage excerpt does not give a reference year or complete counting methods: https://www.odishabiodiversityboard.in/cms/biodiversity-treasure-odisha
- Forest, Environment and Climate Change Department, Government of Odisha, Annual Activity Report 2019–2020, sections on forest and tree cover; recorded forest area and FSI’s 2019 forest-cover assessment: https://forest.odisha.gov.in/sites/default/files/2022-03/FE%20Dept_AAR%20Book-2019-20_English%20%5B1%5D_compressed.pdf
- Forest Survey of India definition of forest cover as reported by the Government of India, Press Information Bureau, “Definition under State of Forest Report”: https://www.pib.gov.in/PressReleasePage.aspx?PRID=1795070
- Forest Department Code, 2020, Government of Odisha, tree-classification entry for Sal. This is an administrative classification, not a statewide ecological inventory: https://forest.odisha.gov.in/sites/default/files/2022-03/Odisha%20Forest%20Department%20Code,%202020.pdf
- Paraseth, P., Paul, R. and Banerjee, K. (2023), “Climate Crisis on Prospective Distribution of Shorea robusta (Gaertn.) in Tropical Deciduous Forests of Eastern Ghats of India,” Indian Forester 149(11), 1122–1132, doi:10.36808/if/2023/v149i11/169433: https://indianforester.co.in/index.php/indianforester/article/view/169433
- Forest, Environment and Climate Change Department, Government of Odisha, Annual Activity Report 2020–21; dated planting and management programme information: https://forest.odisha.gov.in/sites/default/files/2022-03/Annual%20Acticity%20Report%20(Forest%20Department)%2020-21_1.pdf
- Odisha Biodiversity Board, “Research Projects,” sanctuary inventory summaries and project status as presented on the webpage, accessed 31 October 2026: https://www.odishabiodiversityboard.in/activity/433
- Original featured illustration: generated for this article on 31 October 2026; text-free landscape depicting a forest mosaic, not a documentary photograph or a specific identified sanctuary.
Disclaimer
This content is a collection of ancient history,books and various articles and collection of library and news and other post ; all details may not be the same. Readers are requested to verify the information themselves. Readers are not allowed to take any disciplinary action; content is only for educational purposes. If readers do not agree about the contents, they may send a personal comment to my personal email ID: achary.purna@gmail.com
