
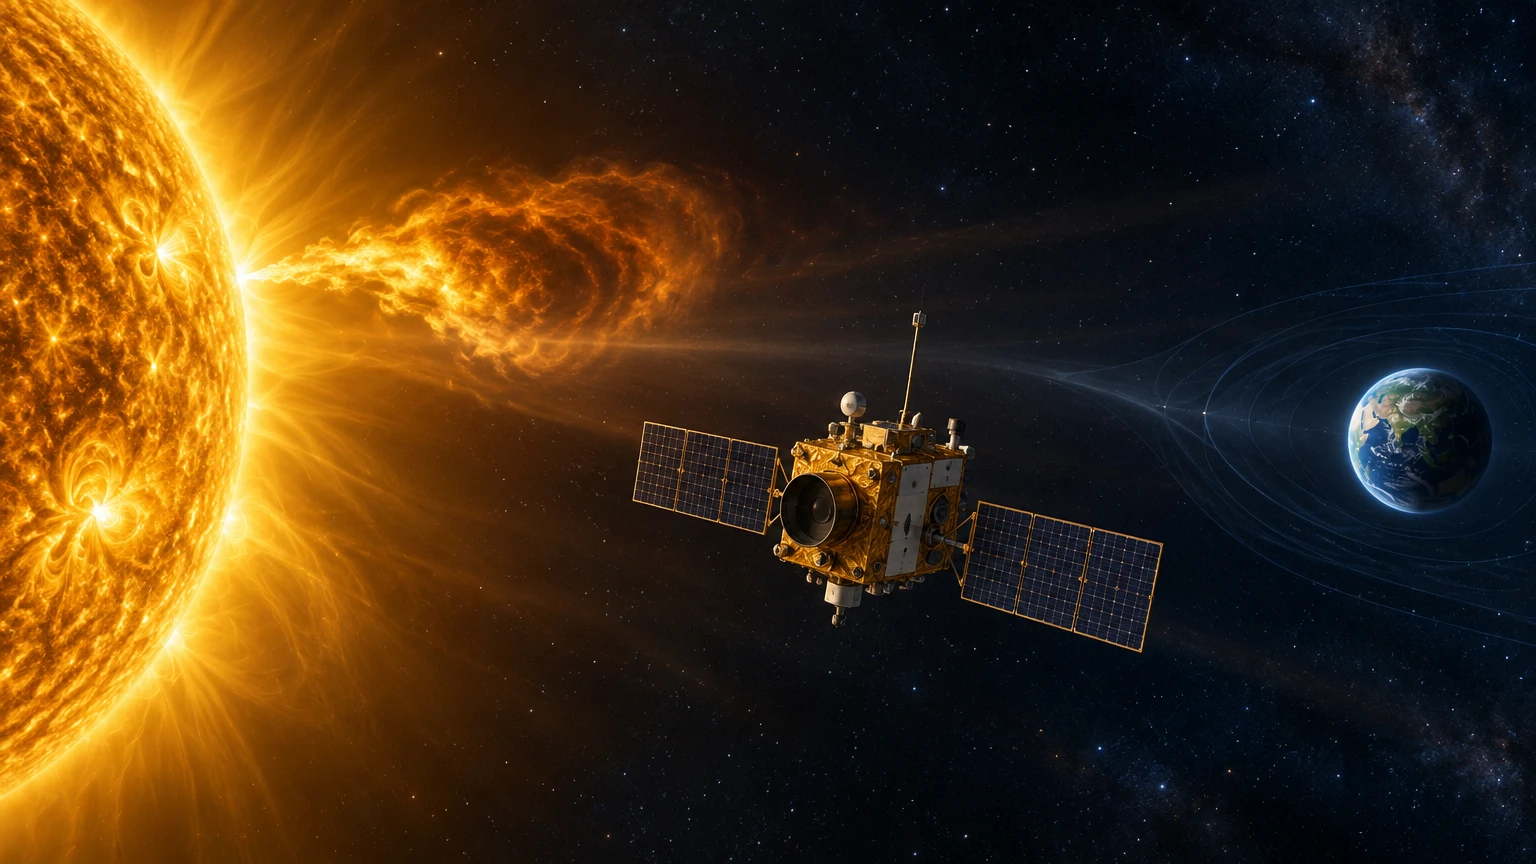
India’s Aditya-L1 is a space observatory built to study the Sun from a vantage point near the Sun–Earth L1 region. The mission is often described as a solar mission, but it is more useful to think of it as a coordinated set of seven experiments: some watch the Sun’s visible and ultraviolet layers, some measure X-rays, and others sample particles and magnetic fields around the spacecraft. Together, they let scientists connect changing structures on the solar disk with conditions in the surrounding space.
This guide explains the mission’s path, why its orbit is useful, what each instrument measures, what early observations have shown, and what the spacecraft cannot tell us by itself. The account focuses on mission science rather than predictions: Aditya-L1 is not a consumer alert service, and a scientific observation is not automatically a forecast or warning.
Why observe the Sun from space?
The Sun is a star whose atmosphere is active on many scales. Its surface and atmosphere produce flares, prominences, coronal mass ejections (CMEs), and streams of charged particles. These events can interact with Earth’s magnetic environment and with satellites and spacecraft. Understanding how an eruption begins, how it moves through the corona, and what particles and magnetic fields accompany it requires measurements at different wavelengths and in more than one physical region.
Ground observatories are valuable, but Earth’s atmosphere absorbs or distorts parts of the electromagnetic spectrum. Ultraviolet and X-ray observations in particular require instruments above the atmosphere. An observatory in space can also maintain a stable view of the solar disk for long observing periods, subject to operational constraints, spacecraft pointing, instrument schedules, and data transmission. Space location does not make an instrument omniscient: every sensor has a field of view, sensitivity, cadence, calibration range, and period of operation.
Aditya-L1 is India’s first dedicated space-based solar observatory. Its science goals include studying the solar corona and its heating, the origin and evolution of flares and CMEs, the physical conditions of solar plasma, and the solar wind and energetic particles. These are research questions, not promises that every eruption will be detected early or that every effect at Earth can be predicted precisely.
What does “L1” mean?
The Sun–Earth system has five Lagrange points: locations where the gravitational pulls of the two large bodies and the motion of a smaller object can combine in a useful way. L1 lies on the line between the Sun and Earth, roughly 1.5 million kilometres from Earth toward the Sun. It is not a physical platform or a place where gravity disappears. A spacecraft near L1 remains in motion and must follow a carefully controlled orbit.
For solar observation, the main practical advantage is a relatively unobstructed line of sight to the Sun. From the L1 neighbourhood, Earth does not regularly pass in front of the Sun as it would for a spacecraft in low Earth orbit, and Earth eclipses are avoided in the planned observing geometry. This supports long, repeatable observing windows. It does not mean that all seven payloads collect data every second or that every image is continuous; commanding, instrument modes, spacecraft operations, calibration, and downlink all shape the actual record.
L1 is also useful for measuring the solar wind before it reaches Earth, but “before” must be interpreted carefully. A measurement at the spacecraft describes the plasma and field at that location and time. The solar wind is structured and evolves as it travels. A local sample can inform models, yet it is not a direct measurement of conditions at every point between L1 and Earth or of what every satellite will experience.
A halo orbit, not a parking spot
Aditya-L1 was launched on 2 September 2023 by PSLV-C57. After a sequence of manoeuvres that raised its orbit around Earth and sent it outward, it entered its planned halo orbit around the Sun–Earth L1 region on 6 January 2024. ISRO reports a nominal orbital period of about 177.86 days. The orbit is a three-dimensional path around the L1 region, not a stable circular track around a solid object and not a stationary position in space.
Why use a halo orbit? A spacecraft cannot simply sit at L1 without maintaining its trajectory. The halo orbit provides a practical observing geometry while avoiding some of the eclipse and occultation conditions that would interrupt a closer Earth orbit. Its design balances mission lifetime, visibility, communication, propulsion and scientific requirements. The spacecraft still needs navigation and station-keeping: small corrections compensate for disturbances and keep it within the intended orbital region.
The mission’s path matters to interpreting its data. Early commissioning and cruise observations occurred before halo-orbit insertion. Those measurements can be scientifically useful, but their time and geometry should not be confused with later routine observations from the operational orbit. A report describing an event observed during cruise does not imply that the spacecraft was already in its final halo orbit at the time.
Seven payloads, two kinds of observation
The payload suite contains seven instruments. Four are remote-sensing instruments that observe the Sun or its corona from a distance: VELC, SUIT, SoLEXS and HEL1OS. Three are in-situ instruments that measure particles or magnetic fields in the spacecraft’s local environment: ASPEX, PAPA and MAG. “Remote sensing” and “in situ” answer different questions. An image can show a structure over a broad region; an in-situ detector can measure the properties of particles passing the spacecraft. The measurements become more informative when scientists compare them, but they are not interchangeable.
The instruments use different wavelength bands, viewing strategies and measurement techniques. Some produce images, some spectra, and some particle or field measurements. A spectrum separates light by wavelength or energy and can reveal temperature, composition, motion or other plasma properties under appropriate assumptions. A particle detector counts and characterizes particles entering its detector. A magnetometer measures field components. These data must be calibrated, time-tagged and interpreted using instrument models and physical analysis.
Payload names can make the mission sound like one camera with seven attachments. In practice, each experiment has its own electronics, operating modes, calibration and science team. One instrument may observe a flare’s brightening while another measures particles near the spacecraft; the observations are linked by timing and analysis, not by a guarantee that the same event is equally visible to every sensor.
VELC: looking at the corona
The Visible Emission Line Coronagraph (VELC) is designed to observe the solar corona, the Sun’s outer atmosphere, by blocking the bright solar disk in a way analogous to a coronagraph. The corona is faint compared with the disk, so suppressing stray light and controlling instrumental effects is essential. VELC observes selected visible emission lines and can use spectroscopic measurements to examine the physical properties and motion of coronal material.
A coronagraph’s field of view and the solar region it can observe are finite. The instrument is not a camera that sees every part of the heliosphere. It records light that reaches its optical system within specified conditions. Researchers then infer quantities such as plasma temperature, density or velocity from the signal, the instrument response and a model of the emitting material. Those inferences include assumptions and uncertainties; they are not direct photographs of every three-dimensional feature.
ISRO has reported VELC observations of a CME on 16 July 2024 and later described analysis of an eruption observed on 5 August 2024. In a report dated 3 November 2026, ISRO said VELC Doppler spectra, imagery from NASA’s Solar Dynamics Observatory and modelling supported an interpretation of asymmetric expansion in that event. The report also indicated that further studies are needed to establish how reliably the method can constrain CME propagation. This is an example of research developing a measurement technique, not evidence that a mature operational prediction system is already in place.
SUIT: the solar disk in ultraviolet light
The Solar Ultraviolet Imaging Telescope (SUIT) images the solar disk in ultraviolet wavelengths. Ultraviolet light comes from layers and processes that cannot be studied in the same way with an ordinary visible-light photograph. The instrument’s observations help researchers examine the photosphere and chromosphere, including how lower-atmosphere activity relates to flares and other changes higher in the atmosphere.
ISRO reported SUIT’s first images in December 2023 and described later observations after the instrument’s door was opened in May 2024. A commissioning timeline matters: first light, instrument opening, calibration, initial observations and regular science operations are distinct milestones. A payload does not become fully characterized simply because it has returned an image; teams must test its response, understand its pointing and establish how to interpret the data.
One reported example is SUIT’s observation of an X6.3 solar flare on 22 February 2024. ISRO described ultraviolet brightening, including flare kernels, and reported relationships between lower-atmosphere emission and the evolution of hotter coronal plasma. This sort of observation helps examine how energy release is manifested in different atmospheric layers. It does not alone prove a complete causal model of every flare, and one event cannot establish that all flares behave identically.
SoLEXS and HEL1OS: X-ray views of activity
SoLEXS, the Solar Low Energy X-ray Spectrometer, measures solar X-rays at lower energies than the harder X-ray range covered by HEL1OS. Solar X-rays are useful for studying hot plasma and flare activity. A spectrometer can track how the distribution of X-ray emission changes over time and energy, which helps scientists estimate plasma conditions and examine the evolution of energetic events.
HEL1OS, the High Energy L1 Orbiting X-ray Spectrometer, focuses on higher-energy solar X-rays. Flares can accelerate particles and heat plasma, producing emissions that change rapidly. Measurements at higher energies can help identify the timing and character of these energetic phases. The instrument complements lower-energy X-ray observations rather than replacing them; different energy bands can trace different populations or stages in an event.
Neither payload should be treated as an alarm by itself. A signal has to be distinguished from background, checked against calibration and interpreted alongside other observations. A plotted increase in counts does not automatically identify the physical source, its direction, or its eventual effects at Earth. Researchers combine the instruments with solar images, spectra, models and observations from other spacecraft to test an interpretation.
ASPEX and PAPA: sampling particles near the spacecraft
ASPEX, the Aditya Solar wind Particle Experiment, measures solar-wind and energetic particles in the spacecraft’s local environment. It includes sensors that study different particle populations. These measurements can help distinguish particle types and energies and track changes in the local plasma associated with solar activity. The word “local” is important: ASPEX records particles arriving at the spacecraft, not a complete map of the solar wind across space.
PAPA, the Plasma Analyser Package for Aditya, studies properties of solar-wind plasma, including particle populations and their distributions. ISRO has reported PAPA observations associated with CMEs on 15 December 2023 and 10–11 February 2024. The December observation was during cruise, before halo-orbit insertion. These measurements show why a particle instrument can contribute even when a spacecraft is still travelling toward its operational orbit, while also reminding readers to distinguish mission phases.
Particle data are not self-explanatory. Detector orientation, energy range, spacecraft motion, instrument mode and background affect what is measured. Researchers calibrate the response and compare the data with known solar-wind behaviour. A particle enhancement associated in time with a CME is a scientific clue; determining its source, structure and connection to Earth requires additional evidence and analysis.
MAG: measuring magnetic fields
The Magnetometer (MAG) measures magnetic-field components around the spacecraft. Magnetic fields are central to the interaction between the solar wind and planetary environments, and their structure can also provide clues about solar eruptions and interplanetary space. A magnetic field measurement is a vector: it has both strength and direction. Changes in those components over time can reveal boundaries, rotations or other structures passing the spacecraft.
MAG’s contribution is complementary to particle measurements. A plasma has particles and fields; combining their properties helps researchers investigate how the solar wind flows and how disturbances evolve. Still, a single spacecraft samples a moving point through a changing environment. It cannot, from one measurement alone, reconstruct every spatial dimension of a large event. Multi-spacecraft observations and models can help infer its broader shape and movement.
Magnetometers also require careful engineering. Spacecraft electronics, magnetic materials and changing instrument conditions can influence measurements. Mission teams characterize and account for these effects so that the returned data better represent the ambient field. Public summaries normally present the scientific interpretation; the underlying data and calibration documentation are important for specialists assessing precision and uncertainty.
How the payloads fit together
Imagine a CME leaving the Sun. A coronagraph may image material as it moves through the corona. Ultraviolet images may show changes on the solar disk near the eruption. X-ray instruments may record rapid flare emission. Particle sensors may later measure a disturbance where the spacecraft is located, while MAG records the associated field. These observations can be compared in time and interpreted as parts of a connected event.
The instruments do not all view the same physical volume at the same instant. Remote images may cover the solar disk or a portion of the corona; local sensors observe the environment around the spacecraft. A CME can be directed away from the spacecraft, miss it, or evolve between the Sun and the measurement point. Even when several instruments observe related changes, establishing the exact relationship requires event timing, geometry, data quality and modelling.
This is why a mission with multiple instruments is valuable: it supplies independent kinds of evidence. It is also why a headline about “seven instruments” should not be simplified into “seven confirmations.” Each instrument answers a different question and has its own limitations. A strong scientific result explains how those lines of evidence fit together and what remains uncertain.
From raw measurements to a scientific conclusion
Spacecraft instruments generate measurements, not finished explanations. Teams first establish whether the data are valid for the intended analysis. They examine calibration, instrument mode, time references, pointing, background and data gaps. Then they may compare observations from more than one instrument or mission, identify a physical model that could explain the signal, and test that model against the available data.
Some quantities are directly measured, such as an instrument’s detector counts or a field component. Other quantities are derived, such as temperature, density, velocity or the three-dimensional shape of an eruption. Derived values depend on assumptions about the instrument and the physical system. Good scientific reporting distinguishes the observed signal from the inferred property and the broader interpretation.
Results may change as a team improves calibration, applies a new method or compares additional events. That is normal in observational science, not evidence that the original measurement was meaningless. It is useful to check whether a source is announcing a raw observation, a peer-reviewed analysis, a technical capability demonstration or an operational service. Those are different levels of maturity and should not be presented as equivalent.
How the mission moved from launch to science operations
The launch on 2 September 2023 began a sequence rather than placing the observatory immediately at L1. The spacecraft first used Earth-orbit manoeuvres to build the energy needed for its transfer. It then travelled toward the Sun–Earth L1 region, where a final insertion manoeuvre placed it into the planned halo orbit in January 2024. Each transition had navigation and propulsion requirements, and the mission teams had to verify spacecraft health along the way.
Instrument commissioning proceeded in stages. Teams checked that payloads powered on, communicated and returned usable measurements. They opened or activated instrument components as required, tested modes, calibrated responses and evaluated early data. Different instruments have different commissioning schedules; a milestone for one payload does not automatically describe the status of all the others.
ISRO has published specific commissioning milestones, including initial SUIT images in December 2023, later operations after the instrument door opened in May 2024, and commencement of regular science observations for instruments at different times. When reading a mission timeline, note the date and the payload named in each announcement. “The spacecraft is in orbit,” “an instrument has first light,” and “routine observations are underway” each describe different events.
Examples of observations reported by ISRO
SUIT’s observation of the X6.3 flare on 22 February 2024 provides an example of ultraviolet imaging used to study the solar atmosphere. The reported brightening features help connect activity in lower layers with changes in the corona. The value of the observation lies in its wavelength coverage and timing alongside other measurements; it should be described as one studied flare, not as a universal flare template.
ISRO has also described VELC’s observation of a CME on 16 July 2024, including analysis of coronal emission. A later report published on 3 November 2026 discusses the 5 August 2024 eruption and an approach combining VELC spectroscopy, NASA Solar Dynamics Observatory imagery and modelling to infer asymmetric expansion. The report’s careful qualification is important: assessing how reliably the technique can constrain propagation needs further study. A promising research method is not automatically a validated forecast product.
Particle observations extend the story beyond images of the Sun. ISRO’s PAPA reports describe CME-related changes in December 2023 and February 2024; the first occurred during the spacecraft’s cruise. These observations illustrate the role of in-situ data, but they also emphasize that the spacecraft measures conditions at its own position. To connect a solar event to a local particle signature, researchers compare timing, direction, energy and other measurements rather than relying on an event label alone.
What Aditya-L1 can contribute to space-weather research
Space weather is a broad research and operational field concerned with solar activity and its effects in space and near Earth. Aditya-L1 contributes observations that can improve understanding of the Sun’s atmosphere, eruptions and solar wind. Better physical understanding can support model development, especially when mission data are combined with observations from other spacecraft and ground-based facilities.
That contribution should not be overstated. A scientific observatory and an operational forecasting centre have different roles. A forecast requires timely data delivery, quality control, interpretation, models, decision thresholds and communication to users. Aditya-L1’s research instruments may supply valuable inputs, but a spacecraft image or paper is not itself an alert to satellite operators, airlines, power utilities or the public. A mission announcement about an event observed months earlier is historical science reporting, not advance notice.
Nor can a single vantage point see every event in full. Solar eruptions have complex three-dimensional structures. A feature may be faint, partly obscured, outside a detector’s field of view or directed away from the observer. The solar wind changes as it travels. These realities make multi-point observation and uncertainty reporting important. They do not diminish the mission; they define the kinds of questions it can help answer.
Data access and responsible interpretation
ISRO’s Indian Space Science Data Centre provides mission information and the PRADAN portal for Aditya-L1 data. Researchers and interested readers should follow the portal’s current access instructions and consult the documentation associated with a dataset. Before drawing conclusions, confirm which instrument produced it, when the measurement occurred, whether the data are calibrated or preliminary, and what units, quality flags and coordinate conventions apply.
A chart or image shared on social media may be cropped, colour-enhanced or shown without its time range and instrument context. Colours are often chosen to represent wavelength, intensity or a derived quantity; they do not necessarily show what a human eye would see. A dramatic image may be real while its caption overstates what the image proves. Check the original mission release or data product before repeating a numerical claim or attributing an effect to a particular event.
News releases are useful for accessible summaries, but they may not include every technical detail. For specialist use, look for a paper, instrument description or data documentation and compare its method and uncertainty statements with the summary. A press release can accurately describe a result while omitting details that matter for a quantitative analysis. The right level of evidence depends on the claim being made.
Common misunderstandings
“L1 means the spacecraft is motionless.” It does not. Aditya-L1 follows a halo orbit around the L1 region and needs trajectory management. “At L1” is convenient shorthand for the neighbourhood and orbit, not a stationary parking coordinate.
“Continuous view means continuous data.” A favourable viewing geometry reduces some interruptions, but instruments have observing schedules, operating modes, downlink constraints and data gaps. The phrase describes the opportunity for long solar viewing, not an assurance that every payload records without a break.
“A CME seen at L1 will hit Earth.” Not necessarily. Eruption direction, width, evolution and the spacecraft’s position matter. A measurement at one location cannot by itself establish the consequences at another.
“An observation is a forecast.” An observation describes measured or inferred conditions. A forecast estimates what may happen in the future, typically using models and operational analysis. The two can inform each other, but they are not the same deliverable.
“One instrument proves the full explanation.” Scientific conclusions are usually stronger when independent measurements agree and alternative explanations are tested. A single instrument can make a major contribution without answering every question about an event.
Questions readers often ask
Is Aditya-L1 the first Indian mission to study the Sun?
It is India’s first dedicated space-based solar observatory. India has other space missions and scientific programmes, but Aditya-L1 is specifically designed around solar observation and measurements near the Sun–Earth L1 region. The distinction is about the mission’s dedicated purpose and instrument suite.
How far away is it?
The L1 region is roughly 1.5 million kilometres from Earth toward the Sun. The spacecraft is not fixed at one exact point; it follows a halo orbit around the region. Exact distance varies along the orbit, so the approximate figure is a useful scale rather than a constant measurement.
How many instruments does it carry?
It carries seven payloads: VELC, SUIT, SoLEXS, HEL1OS, ASPEX, PAPA and MAG. Four conduct remote solar observations, while three make in-situ measurements near the spacecraft. The categories reflect how the observations are made, not a ranking of importance.
Can it predict a solar storm before it happens?
Aditya-L1 helps scientists study the Sun and the solar wind, contributing data to the wider research that can improve understanding and models. It is not, by itself, a public warning service or a guarantee of advance prediction. Forecasts depend on multiple observations, validated methods and operational interpretation.
Where can I find its data?
ISRO’s Indian Space Science Data Centre provides the PRADAN data portal. Check the current portal for available datasets, access conditions and documentation. A public announcement of a payload observation does not necessarily mean that every raw or processed data product is immediately available in the same format.
The larger scientific value
Aditya-L1 is valuable not because it removes uncertainty from solar science, but because it creates a sustained, multi-instrument view from a useful vantage point. Images, spectra, particle measurements and magnetic-field data let researchers test how activity develops from the solar atmosphere into interplanetary space. The instruments complement one another while retaining distinct limits and measurement scales.
As the mission accumulates observations, scientists can compare events, refine methods and identify questions that a single event could not settle. Readers can follow that work most reliably by keeping dates, instrument names, orbit phase and uncertainty attached to each claim. That approach gives credit to what the spacecraft has measured without turning an emerging result into a promise it was never designed to make.
Sources and further reading
- ISRO: Aditya-L1 mission overview
- ISRO: PSLV-C57 launch of Aditya-L1
- ISRO: Halo-orbit insertion
- European Space Agency: What are Lagrange points?
- ISSDC: Aditya-L1 payload details
- Indian Space Science Data Centre: Aditya-L1
- PRADAN Aditya-L1 data portal
- ISRO: SUIT captures a solar flare
- ISRO: SUIT observations during the Aditya-L1 mission
- ISRO: PAPA payload observations
- ISRO: VELC observes a coronal mass ejection
- ISRO: VELC analysis of an August 2024 solar eruption, reported 3 November 2026
- ISRO: Aditya-L1 instrument commissioning and observations
This content is a collection of ancient history,books and various articles and collection of library and news and other post ; all details may not be the same. Readers are requested to verify the information themselves. Readers are not allowed to take any disciplinary action; content is only for educational purposes. If readers do not agree about the contents, they may send a personal comment to my personal email ID: achary.purna@gmail.com
